Varnish Otel
This demo is meant to show how to connect your Splunk Observability Cloud account to a Varnish Enterprise Server. This document is still a work in progress.
You can use the official documentation to guide you.
You can review the splunk-otel-collector configuration files located in /etc/otel/collector.
As mentioned in the Splunk documentation, the agent_config.yaml and gateway_config.yaml files contain the configurations for deploying the Collector in host monitoring or data forwarding mode.
No changes are needed unless you have implemented a firewall. In that case, you can refer to the splunk-otel-collector.conf.example file for guidance.
Start the collector:
systemctl start splunk-otel-collector
systemd Drop-InCreate a drop-in to point varnish-otel at the splunk agent:
mkdir -p /etc/systemd/system/varnish-otel.service.d
cat << EOF > /etc/systemd/system/varnish-otel.service.d/splunk.conf
[Service]
# At the time of writing, Splunk doesn't support log ingestion through opentelemetry
Environment=OTEL_LOGS_EXPORTER=none
Environment=OTEL_EXPORTER_OTLP_ENDPOINT=http://localhost:4317
EOF
Now that we have done this, let’s tell systemd to update its configuration to use the drop-in and restart the service:
systemctl daemon-reload
systemctl restart varnish-otel.service
And finally, lets check the Drop-In is enabled:
systemctl show varnish-otel.service | grep Environment
systemctl status varnish-otel.service
We should see first the Environment Variables we declared in the conf file, and then we should also see a a Drop-In section in the status statement like this:
root@opentelemetry-debian-test:~# systemctl status varnish-otel.service
● varnish-otel.service - Varnish OTLP Exporter
     Loaded: loaded (/lib/systemd/system/varnish-otel.service; enabled; preset: enabled)
    Drop-In: /etc/systemd/system/varnish-otel.service.d
             └─varnish-otlp-splunk-exporter.conf
     Active: active (running) since Fri 2025-01-10 00:32:14 UTC; 17h ago
   Main PID: 5234 (varnish-otlp-ex)
      Tasks: 7 (limit: 1108)
     Memory: 21.9M
        CPU: 20min 12.495s
     CGroup: /system.slice/varnish-otel.service
             ├─5234 /usr/bin/varnish-otel
             └─5240 varnishlog-json -g request
To test it further we can make some curls to localhost and we should see the results in the Splunk Observability Cloud UI like this:
# this will give us a 503 from Varnish, but that's fine, we will still see this in Splunk Observability Cloud UI and that's all we are trying to test
curl localhost:6081/this-is-a-test
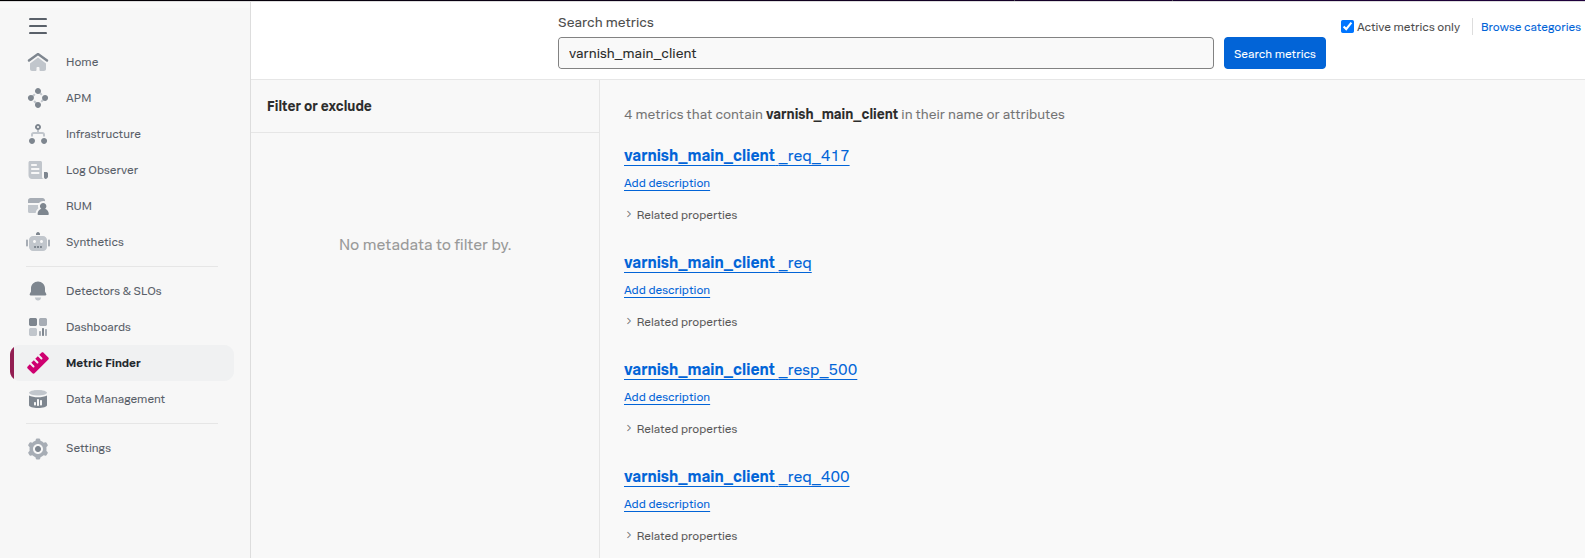
From the left-hand menu, go to the Metrics tab or Metrics Explorer.
Use the search bar to find metrics related to Varnish.