Varnish Otel
If you don’t already have a Dynatrace account, sign up for a free account.
Create an access token with at least the following scopes:
openTelemetryTrace.ingestmetrics.ingestlogs.ingestThe token should start with dt.... Make sure to copy it as it won’t appear again and we’re going to need it in the next step.
systemd Drop-InNext we just need to point varnish-otel at the ingest endpoint that Dynatrace uses, specifying the right protocol and token. We do this by creating a simple systemd drop-in file:
cat << EOF > /etc/systemd/system/varnish-otel.service.d/dynatrace.conf
[Service]
Environment=OTEL_EXPORTER_OTLP_PROTOCOL=http/protobuf
Environment=OTEL_EXPORTER_OTLP_ENDPOINT=https://<your-environment-id>.live.dynatrace.com/api/v2/otlp
Environment=OTEL_EXPORTER_OTLP_HEADERS="Authorization=Api-Token <your-access-token>"
EOF
Simply replace <your-environment-id> with your environment id (the string before “.apps.dynatrace.com”), and <your-access-token> with the token created above.
Make sure to restart the service after applying the configurations:
systemctl daemon-reload
systemctl restart varnish-otel.service
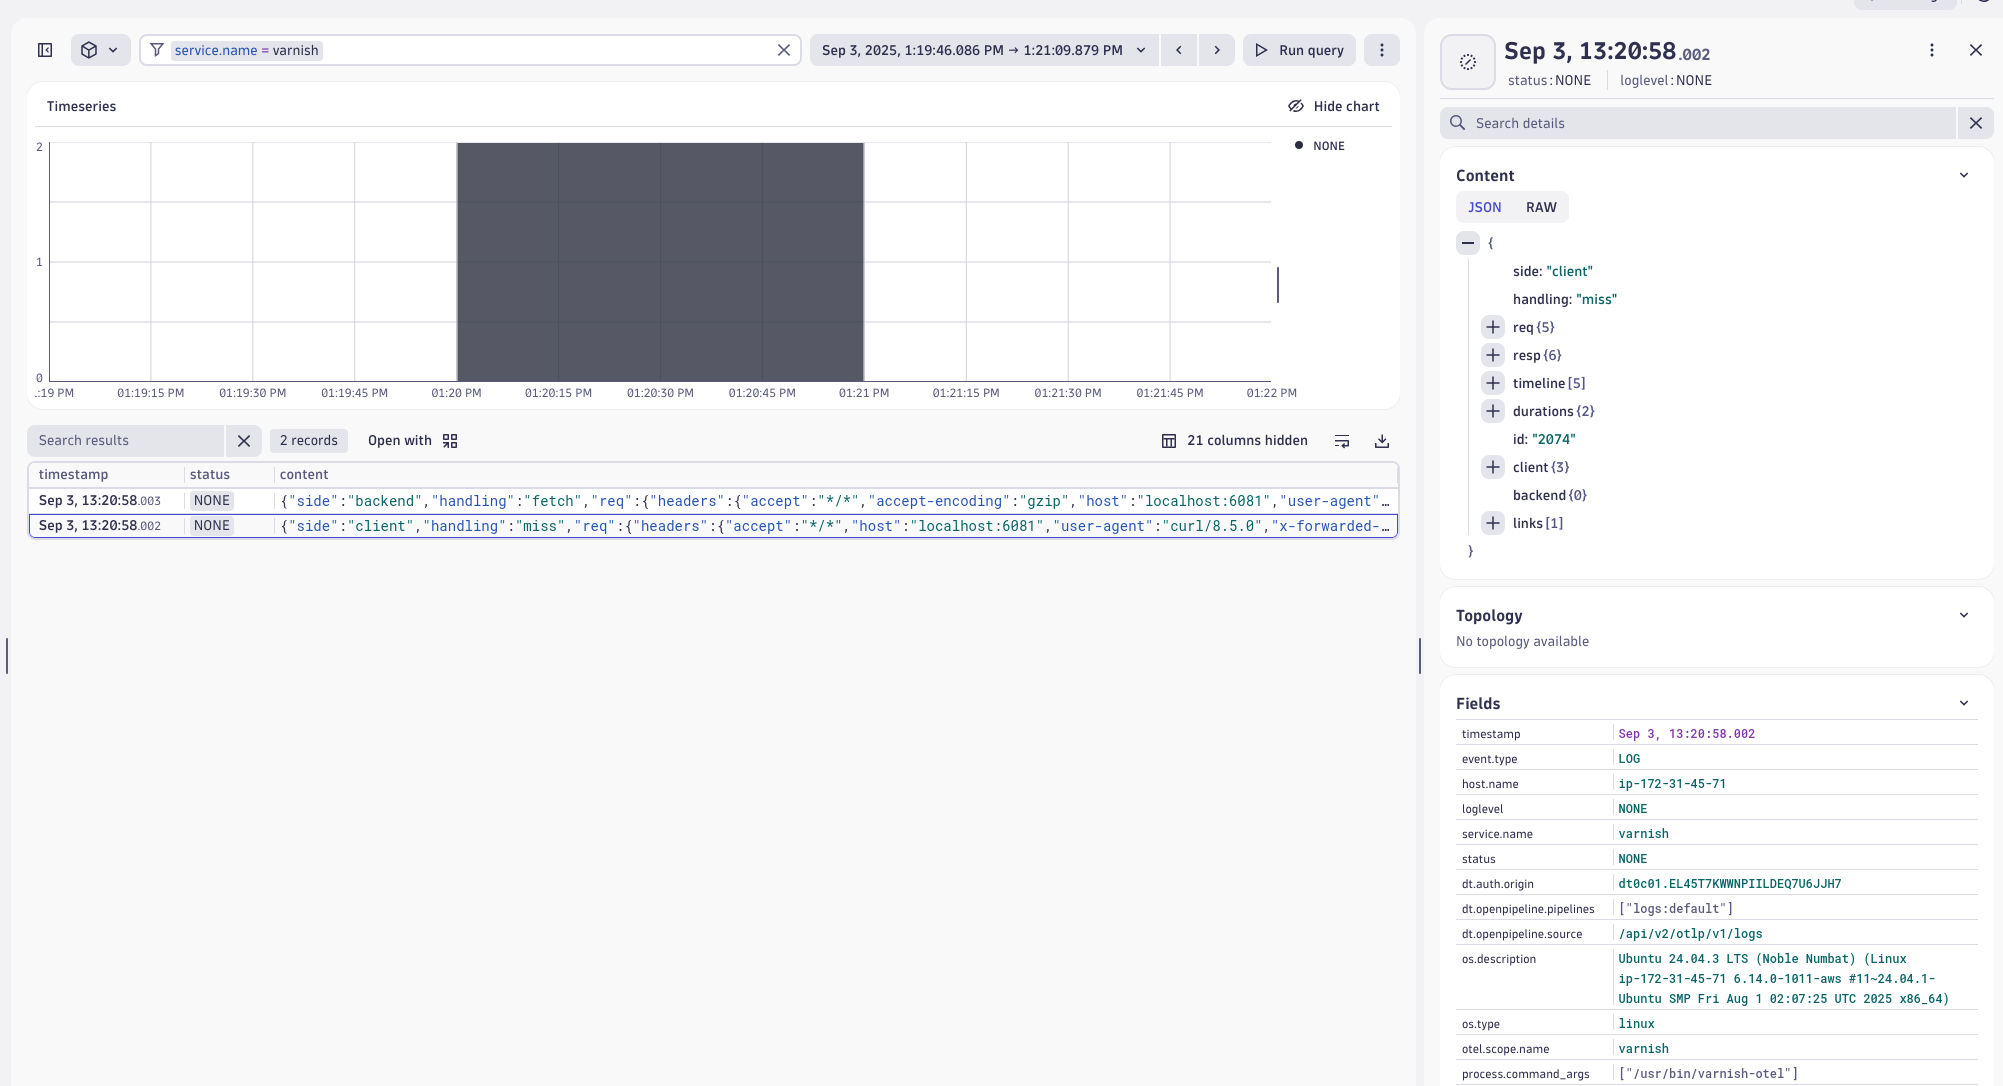
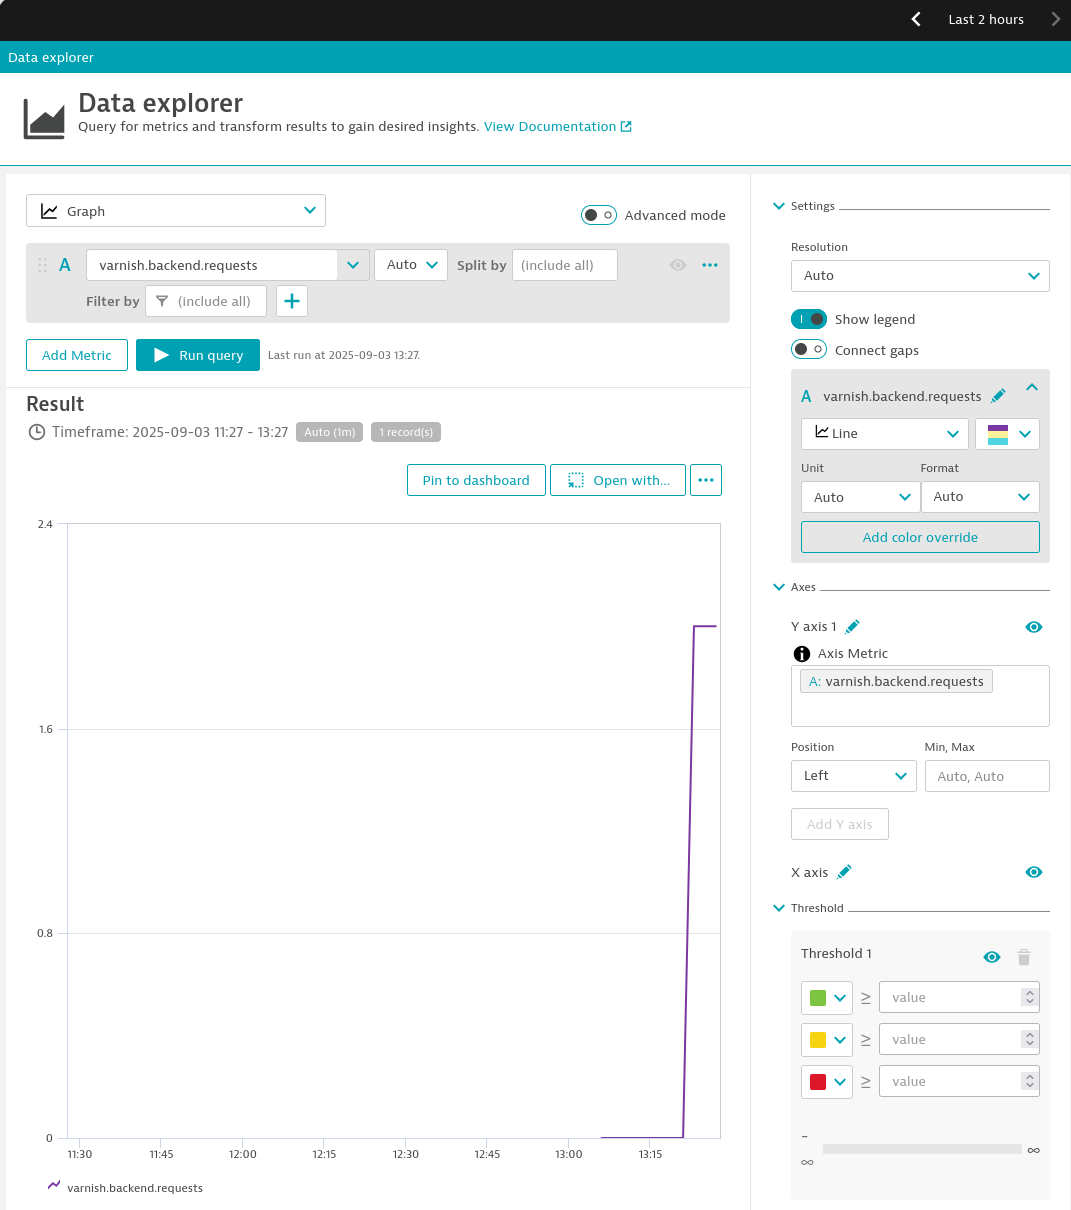
To test if everything is working, you can send some curl requests to localhost, and the results should appear in the Dynatrace UI as expected:
# this is only for testing so you can expect a 503 from Varnish

curl localhost:6081/