Varnish Otel
This demo is made to show you how to connect your Grafana dashboard to a Varnish Enterprise Server.
If you don’t have a Grafana account, here is the link to their page to Get Started for Free.
There is a ready-to-use project in the varnish/toolbox that can be used for initial setup. This uses Docker to easily get Varnish, Grafana, OTEL, and other dependencies running into your local machine.
After you clone the repository, go into the correct directory. All the configuration files we need are in the grafana-monitoring-otel folder.
git clone https://github.com/varnish/toolbox.git
cd toolbox/docker-compose-examples/grafana-monitoring-otel
Make sure that you have a Varnish Enterprise license (varnish-enterprise.lic) as you will need it for the set up. If you don’t have one, you can ask for it here.
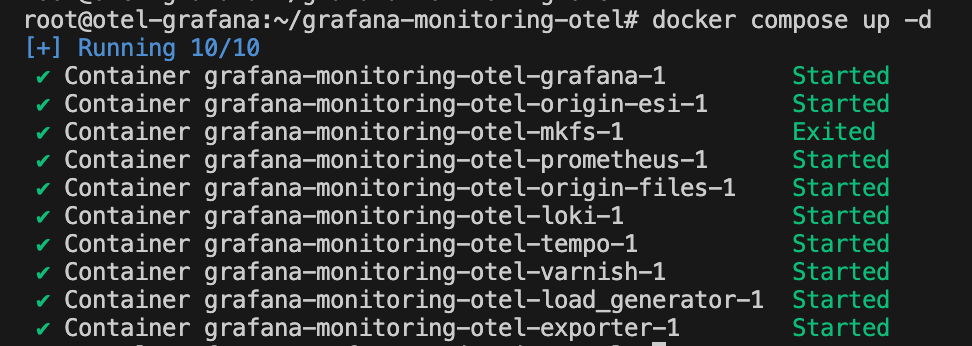
When you have the repository and Varnish license in place, on your terminal, you can run the following from the grafana-monitoring-otel directory:
docker compose up
You can add -d at the end to let it run in the background.
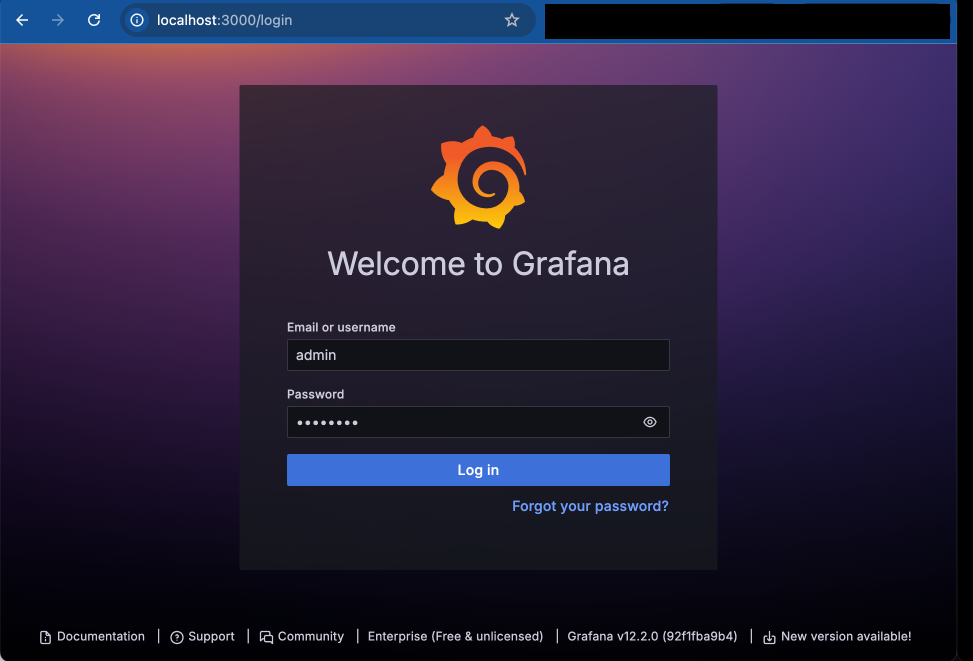
Once the containers are running, open your web browser and go to http://localhost:3000.
Log in to Grafana with admin and password.
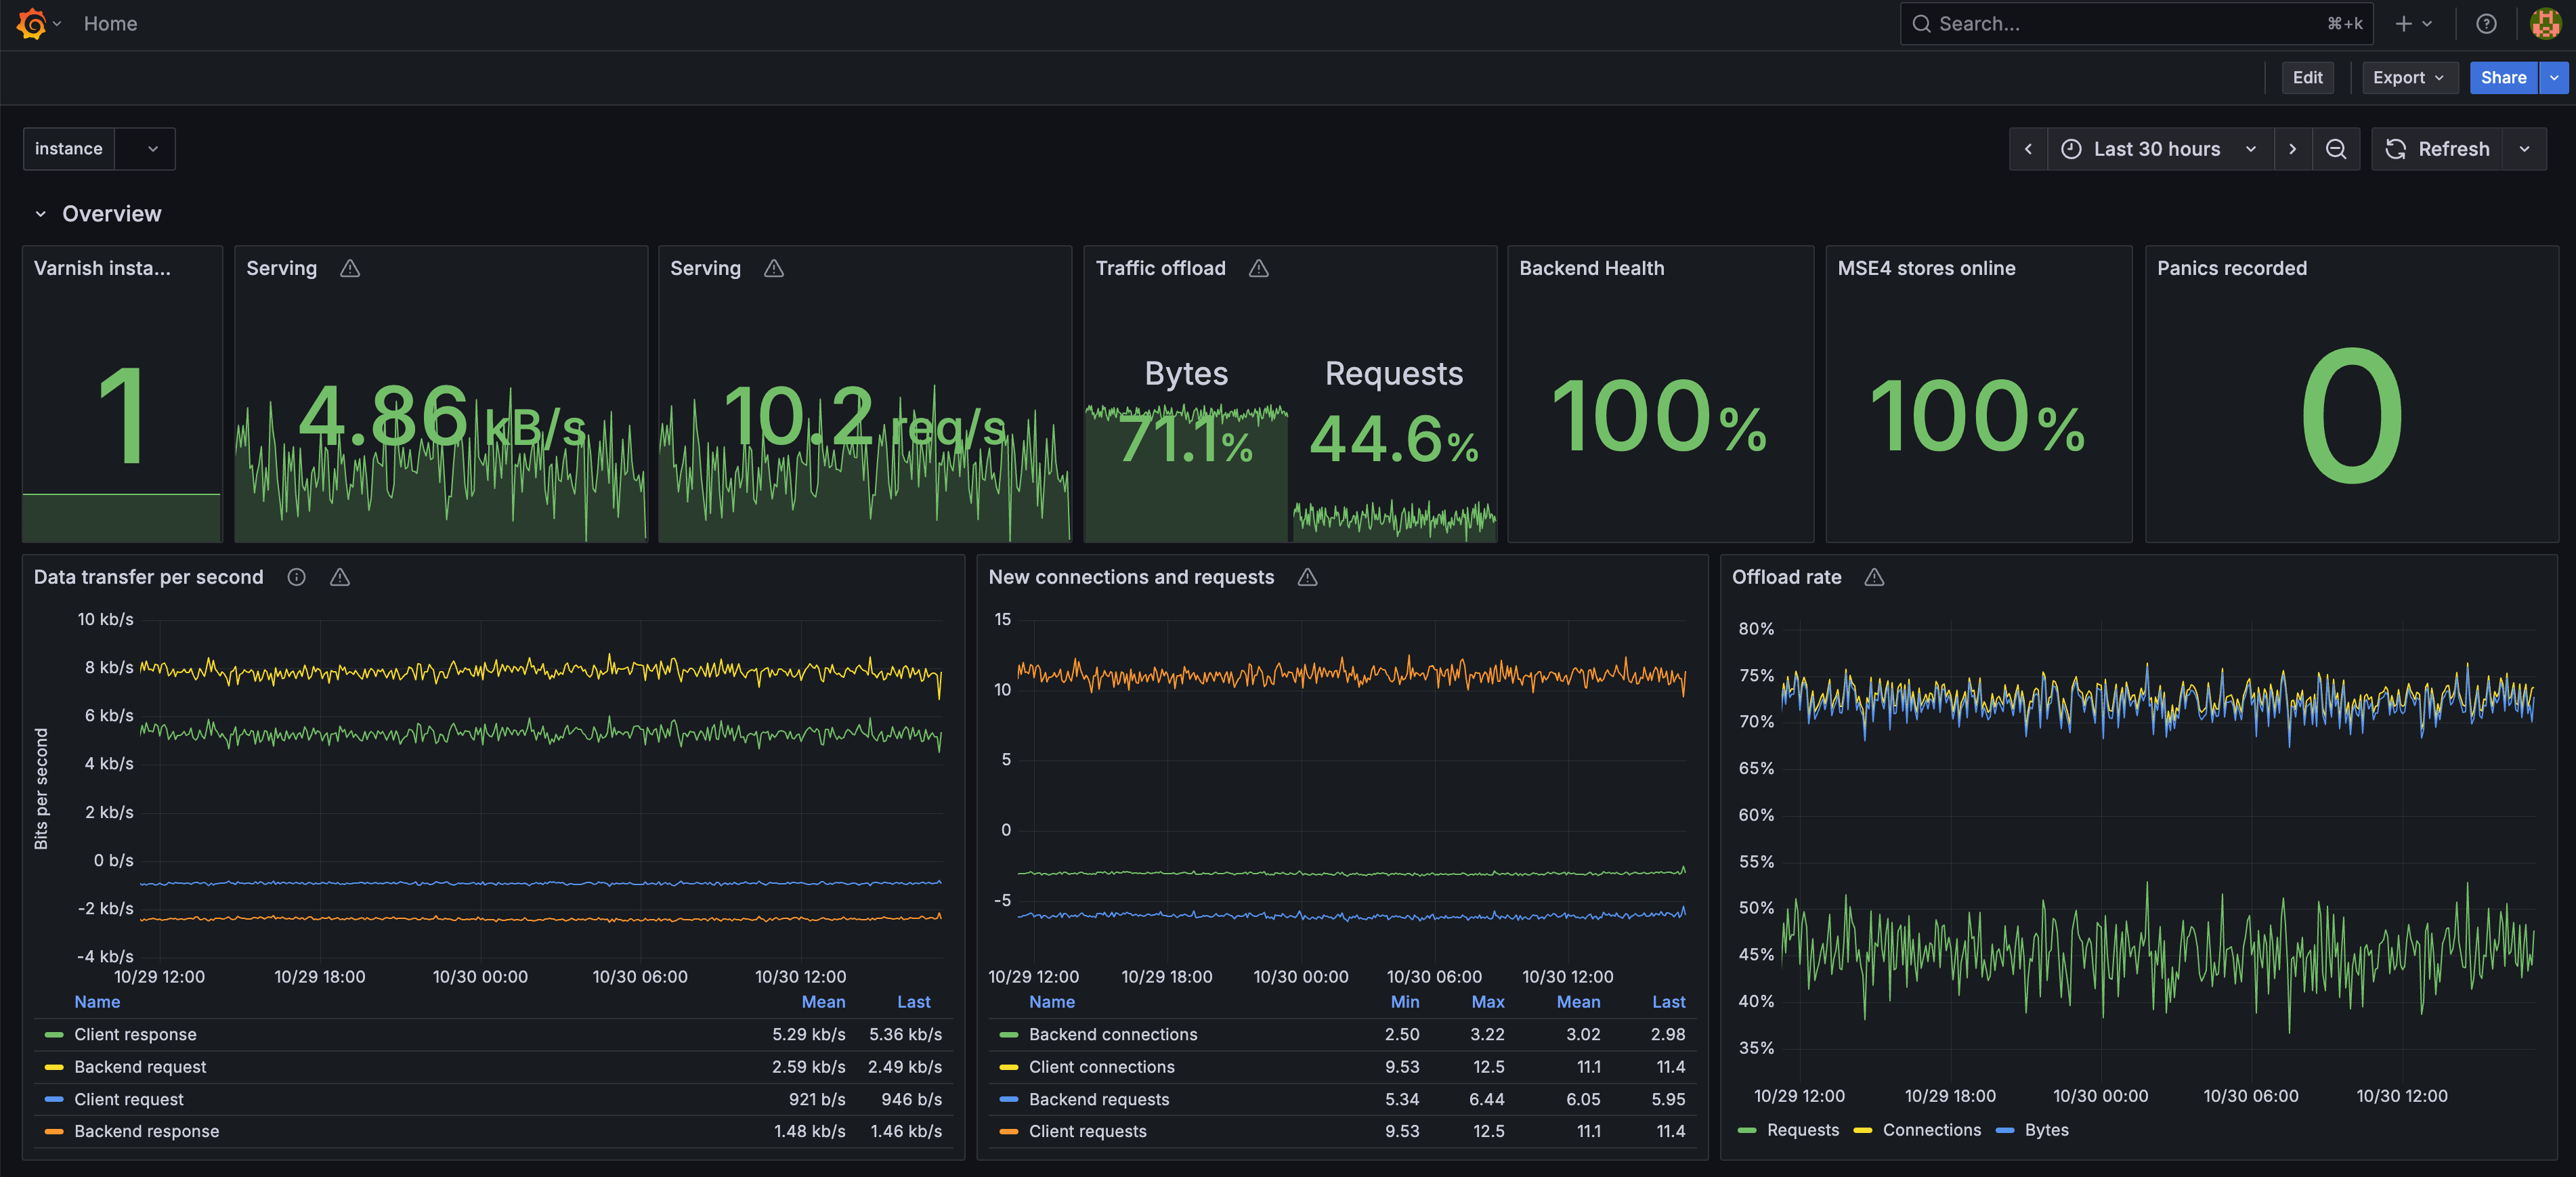
Once in, you will see a pre-built Dashboard with Varnish Metrics.
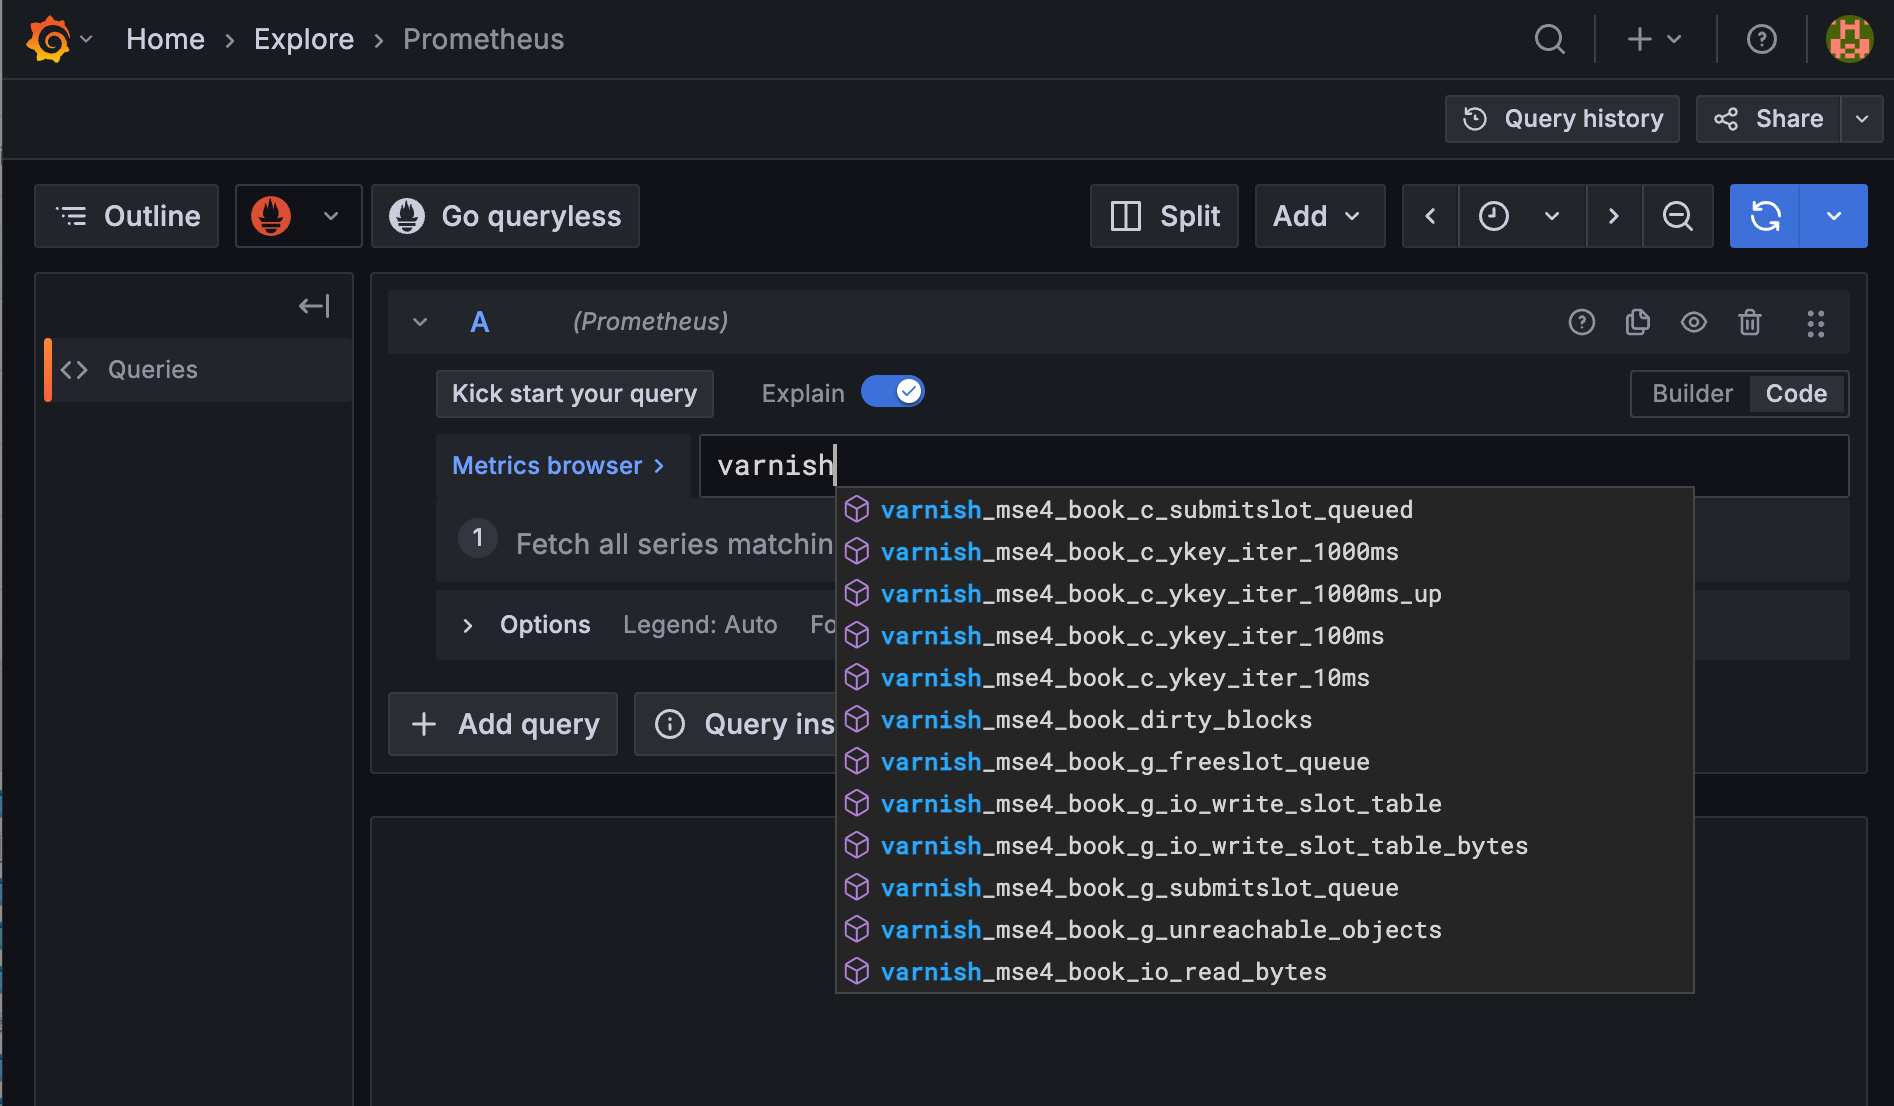
You can check the various data sources in the Explore tab: