Varnish Custom Statistics
The user interface (UI) provides an intuitive experience in visualizing and reporting on the utilization and performance of Varnish Enterprise with Varnish Custom Statistics (VCS).
Using a web browser, the UI is accessible by navigating to the URL (IP or hostname) of the VCS server. By default, the VCS web server is listening to requests on port 6555.
For example, if the VCS server is running on your local host the URL would be: http://127.0.0.1:6555/
Note: The previous version (V1) of the UI can be accessed at the /v1 path.
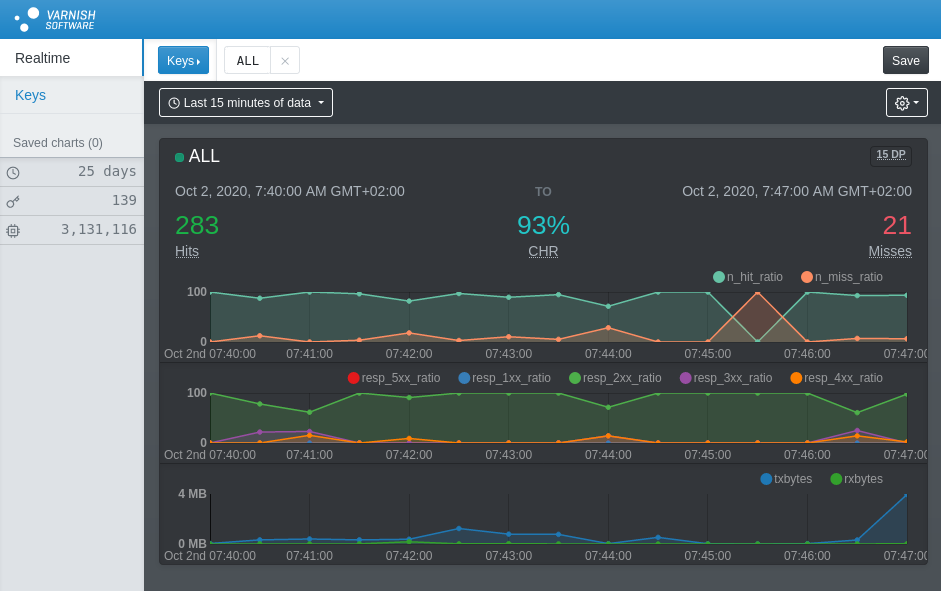
The Realtime dashboard provides a live view into VCS with graphical time series charts and statistical summaries for a given time window.
For each key that is selected, the realtime dashboard will continuously update and present the latest statistical data from VCS.
The “Keys” dropdown menu provides a list of all the available keys. Keys can be sorted by request, ascending and descending order, or filtered by a search query (Regular expression is supported).
Note: Keys are collected and aggregated in VCS and the UI only presents the keys from VCS.
| Field | Description |
|---|---|
| Hits | A summary of the cache hits for the time window. Hits are calculated by subtracting the metrics n_req from n_miss. |
| CHR | A summary of the cache hit ratio (CHR) for the time window. The CHR is calculated with this formula (n_req - n_miss) / n_req * 100. |
| Misses | A summary of the cache misses for the time window. A cache miss represents a request that goes to the backend. |
| DP | The number of data points that are being summarized and graphed. A single data point is equivalent to a single bucket. |
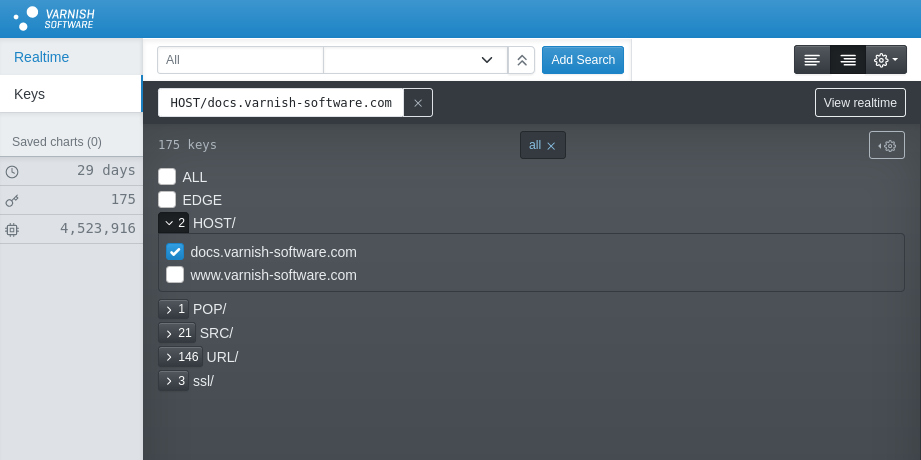
The Keys explorer allows quick exploration and searching of keys (cache content) in VCS.