When you put Varnish in front of your origin servers, the logs on the origin will not be very useful. Because the goal is to dramatically reduce the number of requests to the origin, the server logs will only contain a fraction of what the actual traffic represents.
That’s why Varnish has a quite extensive logging mechanism: not only to mimic NCSA-style logs, but to give operators insight about the flow within Varnish.
Varnish comes with various logging tools to provide this insight:
varnishlog: displays log entriesvarnishtop: presents a continuously updated list of the most
commonly occurring log entriesvarnishncsa: formats log entries in Apache/NCSA “combined” log
formatStoring Varnish logs in files by default is a bad idea. A system like Varnish is used to process massive amounts of concurrent requests. If every request were to be persisted on disk as a log line, the load on the system would be unbearable.
Even if your system can handle the load, there’s the challenge of fitting these logs on disk. Depending on the kind of logs you generate, the verbosity and size can be huge.
Although it is possible to have log files in Varnish, the standard mechanism is to store logs in an in-memory circular buffer. This means that as soon as the buffer is full, it is overwritten.
We call this the Varnish Shared Memory Log (VSL), and it is the core
of Varnish’s logging infrastructure. The vsl_space runtime parameter
defines the size of the VSL, which defaults to 80 MB. This value can
be increased all the way up to 4 GB.
The
-loption ofvarnishdis shorthand for-p vsl_space=
varnishlog, varnishtop, and varnishncsa use the VSL as their
source of input and offer various ways to format, filter, and query the
logs.
Here’s a quick teaser of what varnishlog output looks like:
*   << Request  >> 2
-   Begin          req 1 rxreq
-   Timestamp      Start: 1606224128.870382 0.000000 0.000000
-   Timestamp      Req: 1606224128.870382 0.000000 0.000000
-   ReqStart       172.19.0.1 37632 a0
-   ReqMethod      GET
-   ReqURL         /
-   ReqProtocol    HTTP/1.1
-   ReqHeader      Host: localhost
-   ReqHeader      User-Agent: curl/7.64.1
-   ReqHeader      Accept: */*
-   ReqHeader      X-Forwarded-For: 172.19.0.1
This output is only an extract because the full log output for this transaction is far too verbose.
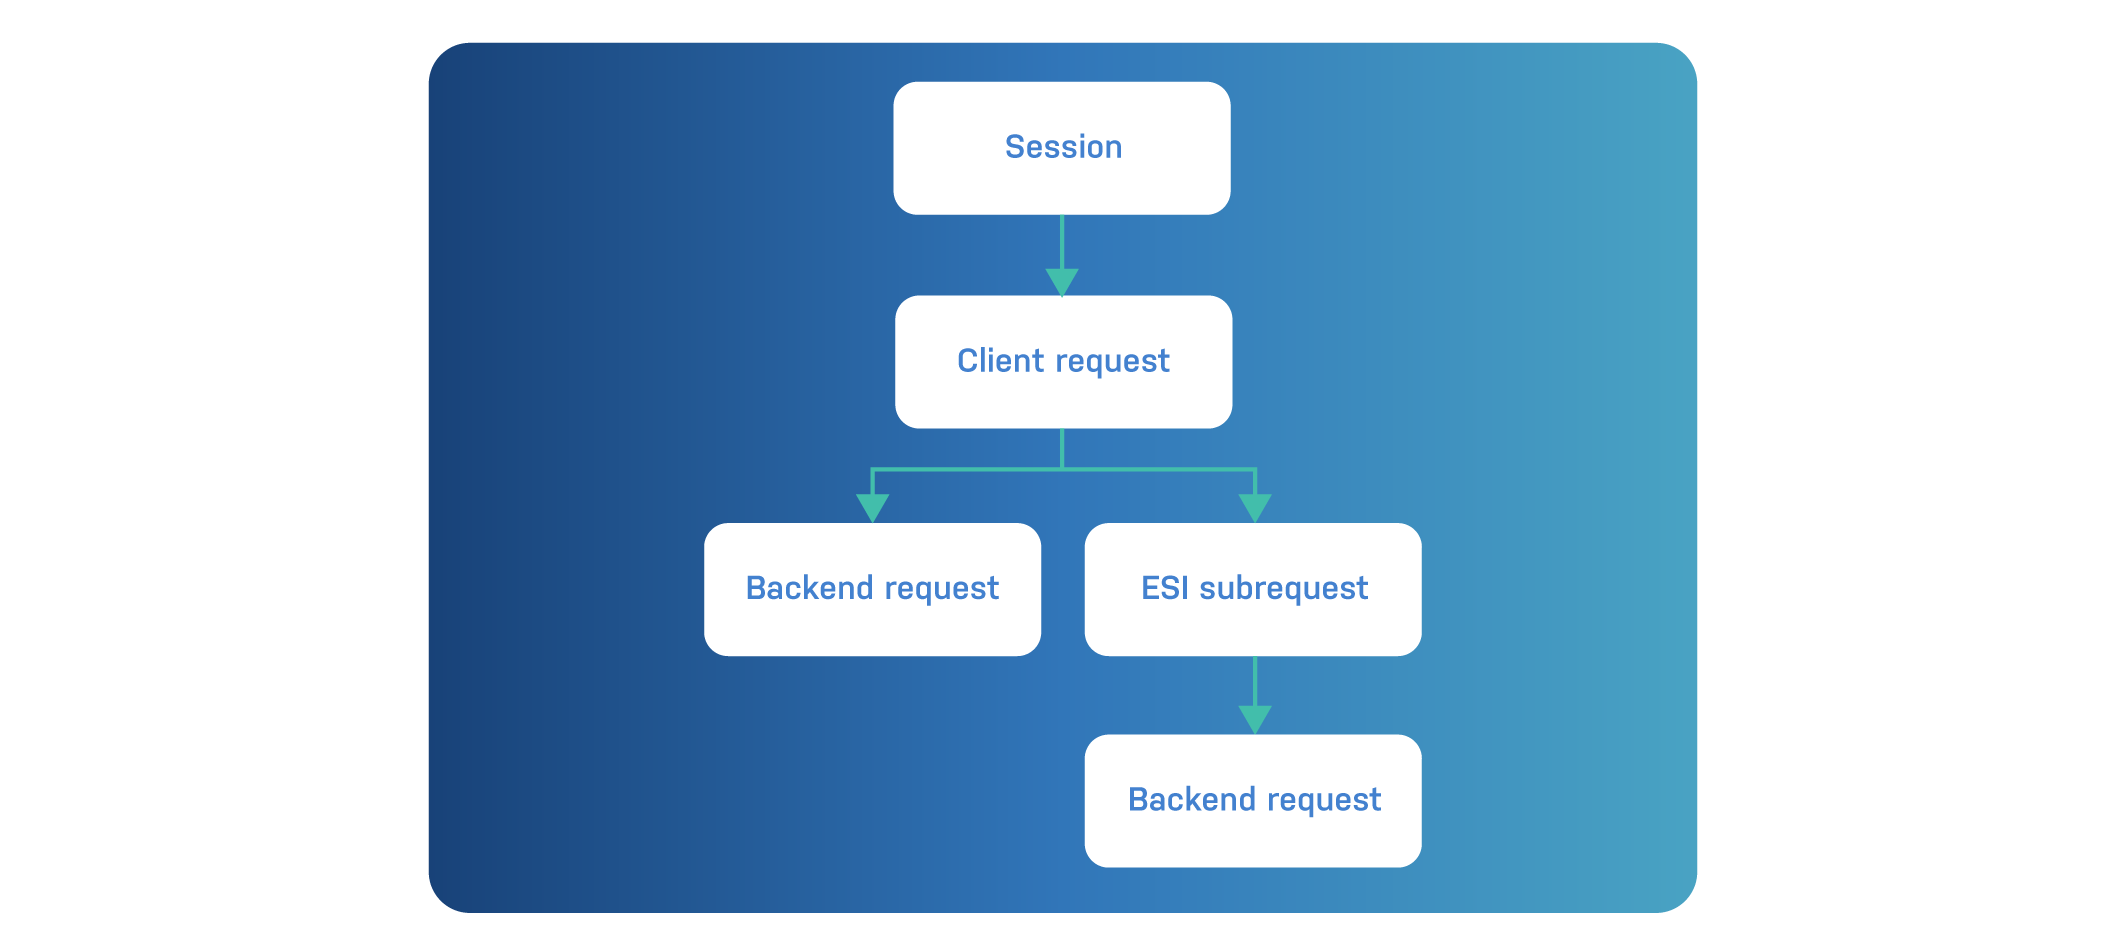
VSL keeps track of transactions. Each transaction contains a number of log lines and is identified by a transaction identifier, which we call the VXID.
Transactions are either sessions or requests:
There are different kinds of request transactions:
There is a hierarchy between transactions, which is illustrated in the diagram below:
Here’s what this looks like in VSL:
*   << BeReq    >> 3
-   Begin          bereq 2 fetch

*   << BeReq    >> 5
-   Begin          bereq 4 fetch

*   << Request  >> 4
-   Begin          req 2 esi

*   << Request  >> 2
-   Begin          req 1 rxreq

*   << Session  >> 1
-   Begin          sess 0 HTTP/1
The Begin tag is used at the start of each transaction.
The first << BeReq >> transaction has VXID 3. The Begin tag for
this transaction indicates that this is a regular fetch that was
initiated by VXID 2.
The second << BeReq >> transaction has VXID 5. The Begin tag for
this transaction indicates that this is a regular fetch that was
initiated by VXID 4.
The first << Request >> transaction is identified by VXID 4, and its
Begin tag is an ESI subrequest that was initiated by VXID 2.
The second << Request >> transaction is identified by VXID 2, and
its Begin tag is a regular request that was initiated by VXID 1.
The << Session >> transaction is identified by VXID 1 and opens up a
connection for HTTP/1.1 traffic. It doesn’t depend on any other
transaction, hence the reference to VXID 0.
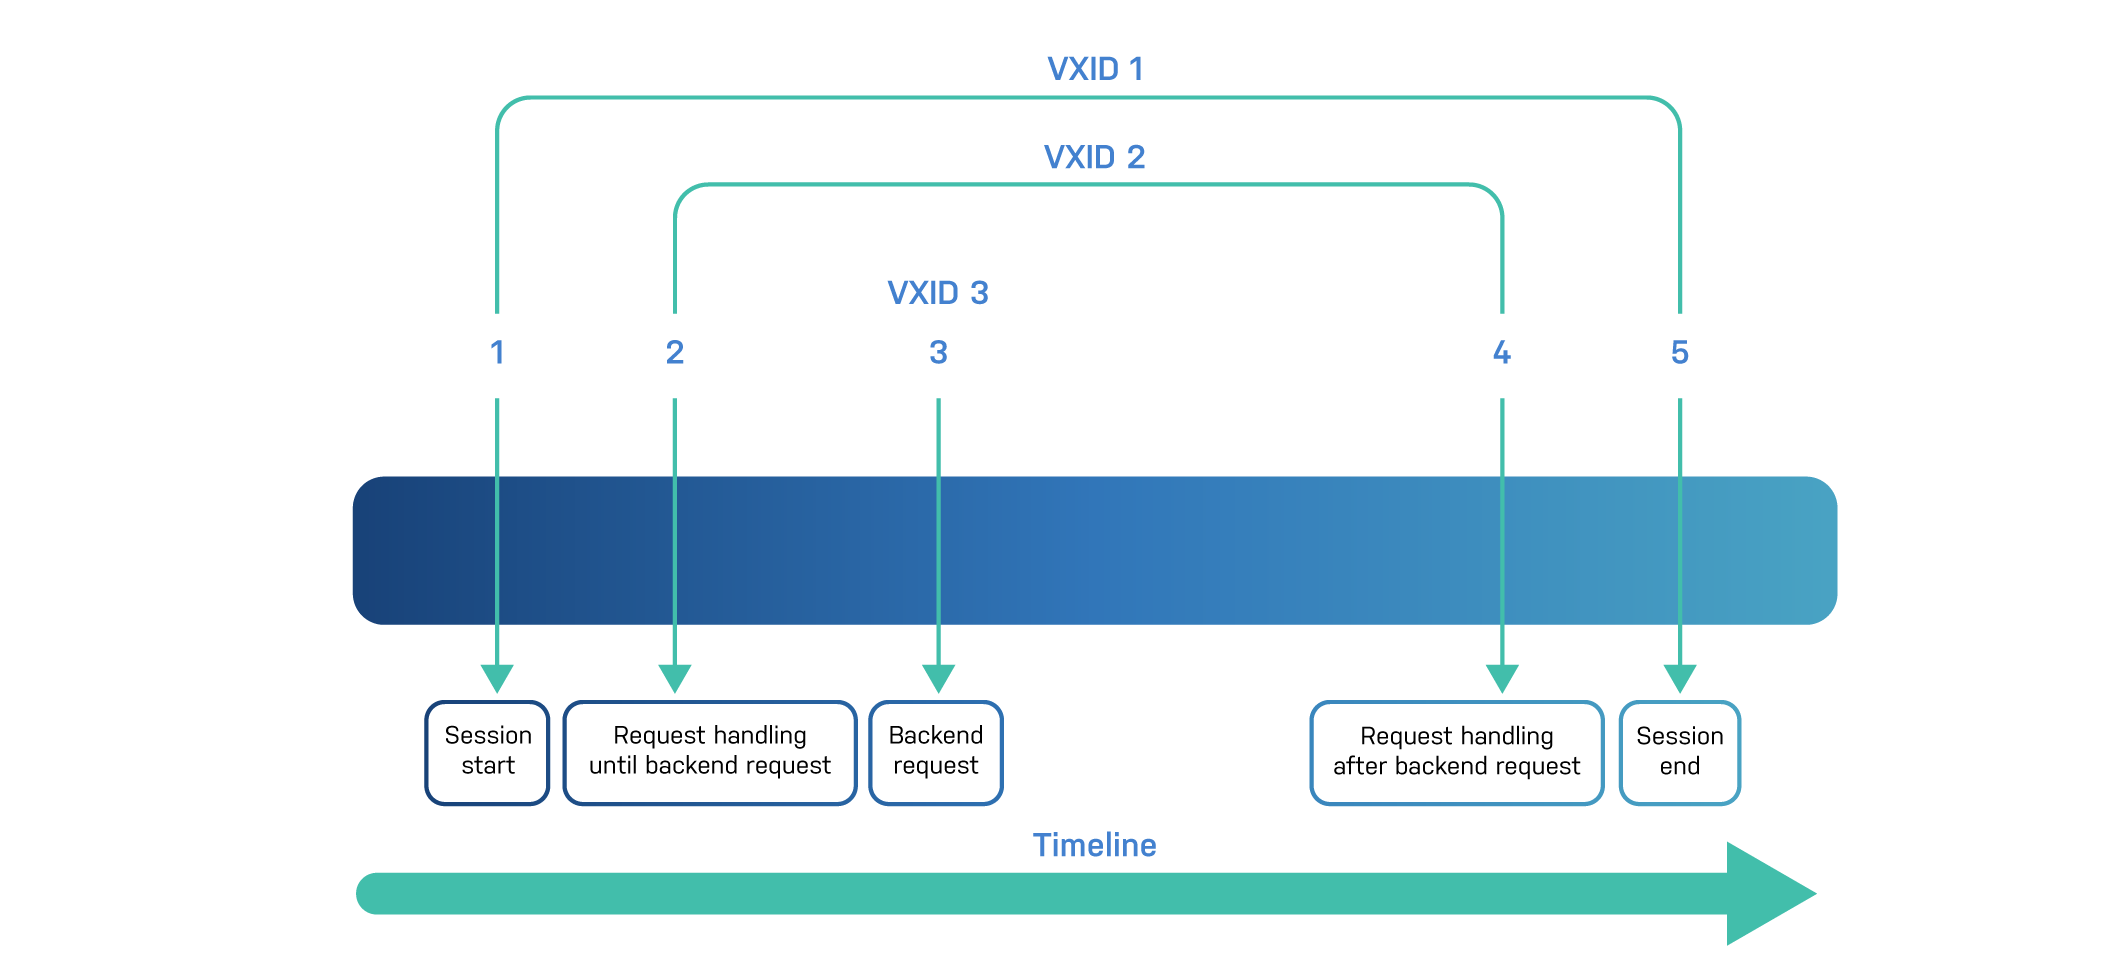
Transactions can be grouped, and the type of grouping that is used will influence the order of the transactions.
By default transactions are displayed in the order in which they complete, which at first glance looks like the reverse order and can seem puzzling.
Here’s another diagram that should illustrate this effect:
 height=“2.9629844706911634in”}
In this simple example, the backend request, identified by VXID 3, is the only transaction that doesn’t depend on another and is displayed first.
The request, identified by VXID 2, can only complete after the backend transaction and will be displayed next.
And finally the session, identified by VXID 1, is displayed because it was waiting for the client request to complete.
You can choose the following grouping modes to change the order:
This is our VSL output grouped by session:
*   << Session  >> 1
-   Begin          sess 0 HTTP/1
**  << Request  >> 2
--  Begin          req 1 rxreq
*** << BeReq    >> 3
--- Begin          bereq 2 fetch
*** << Request  >> 4
--- Begin          req 2 esi
*4* << BeReq    >> 5
-4- Begin          bereq 4 fetch
As you can see, the order is more intuitive, and there’s a level of indentation.
In situations where you primarily care about requests and not the TCP session information, you can group by request and omit the session transaction.
Here’s what that looks like:
*   << Request  >> 2
-   Begin          req 1 rxreq
**  << BeReq    >> 3
--  Begin          bereq 2 fetch
**  << Request  >> 4
--  Begin          req 2 esi
*** << BeReq    >> 5
--- Begin          bereq 4 fetch
You can see that VXID 1 is no longer included and that VXID 2 is not the top-level transaction. And the indentation remained.
As far as raw grouping goes, here’s some example output:
 1 Begin          c sess 0 HTTP/1
 3 Begin          b bereq 2 fetch
 5 Begin          b bereq 4 fetch
 4 Begin          c req 2 esi
 2 Begin          c req 1 rxreq
As you can see, the log lines are no longer grouped in transactions. They are displayed as they are received. As soon as some production traffic hits your Varnish server, raw grouping becomes nearly impossible to use.
However, raw grouping still has its purpose and is also the only way to collect non-transactional logs, logs that aren’t tied to a session, request or backend request task. Non-transactional logs have the VXID 0 to reflect the absence of a transaction ID.
When using varnishlog, varnishtop, or varnishncsa, the -g
parameter can be used to control the grouping.
Here are some examples:
$ varnishlog -g request
$ varnishlog -g session
$ varnishlog -g vxid
$ varnishlog -g raw
Each VSL transaction contains a number of log lines. Each line has a tag and that tag has a corresponding value.
In the previous examples we’ve limited ourselves to the Begin tag to
indicate the beginning of each transaction. But there are a lot more
tags that can be displayed in the VSL output.
We first need to finish our work with transactions. Here’s the list of transaction-related tags:
Begin: marks the start of an VXID transactionEnd: marks the end of an VXID transactionLink: links to a child VXID transactionAnd here’s an example where these tags are used:
*   << Request  >> 2
-   Begin          req 1 rxreq
-   Link           bereq 3 fetch
-   End
**  << BeReq    >> 3
--  Begin          bereq 2 fetch
--  End
This is the format of the Begin tag:
%s %d %s
|  |  |
|  |  +- Reason
|  +---- Parent vxid
+------- Type ("sess", "req" or "bereq")
As you can see it starts either sess, req, or bereq to indicate
the type of transaction. The parent VXID has been covered extensively,
so there’s no reason to elaborate on that. The reason field clearly
indicates why or how this transaction is taking place.
The End tag may look a bit unnecessary, because it seemingly doesn’t
add any value to the logs. But it is used internally to delimit
transactions, and if a transaction takes too long to complete an
End synth record might be synthesized to reflect that. The
varnishlog options -L and -T might lead to incomplete transactions
being displayed.
The Link tag is also quite useful, as it shows what kind of child
transaction is initiated from the current one.
Here’s the format:
%s %d %s
|  |  |
|  |  +- Reason
|  +---- Child vxid
+------- Child type ("req" or "bereq")
A transaction can either trigger a (sub-)request, or a backend
request. Hence the types req and bereq. The Link tag will also
display the VXID of the child transaction. And finally, the reason why
this happens is displayed.
SessOpen: displays the socket endpoints when a client connection
has been openedSessClose: displays the reason for the socket closure and the
duration of the sessionHere’s an example where these two tags are used within a session transaction:
*   << Session  >> 1
-   SessOpen       127.0.0.1 51726 a0 127.0.0.1 80 1606299467.161264 19
-   SessClose      REM_CLOSE 0.004
In order to understand what the values of SessOpen are, here’s the
format for this tag:
%s %d %s %s %s %f %d
|  |  |  |  |  |   |
|  |  |  |  |  |   +- File descriptor number
|  |  |  |  |  +----- Session start time (unix epoch)
|  |  |  |  +-------- Local TCP port
|  |  |  +----------- Local IPv4/6 address
|  |  +-------------- Socket name (from -a argument)
|  +----------------- Remote TCP port
+-------------------- Remote IPv4/6 address
So let’s explain the meaning of the values from the example:
127.0.0.1 is the IP address of the client.51726 is the port number of the client.a0 is the name of our socket. Because we didn’t name it via -a,
the name a0 was automatically assigned by Varnish.127.0.0.1 is also the IP address of the server.80 is the port number of the server. This indicates regular HTTP
traffic.1606299467.161264 is the epoch equivalent of
Wednesday, November 25, 2020 10:17:47.161 AM.19 is the file descriptor number.And from the SessClose tag we can determine that the session was
closed normally and lasted four milliseconds.
The most commonly used VSL tags are request tags. They refer to the HTTP request that is made by the client.
Here’s an overview of these tags:
ReqStart: the start of request processingReqMethod: the HTTP method used to perform the requestReqURL: the URL that is addressed by the requestReqProtocol: the HTTP version used by the requestReqHeader: a set of request headers that were passedReqAcct: the byte counts for the request handlingHere’s an example that features these tags:
-   ReqStart       127.0.0.1 51726 a0
-   ReqMethod      GET
-   ReqURL         /
-   ReqProtocol    HTTP/1.1
-   ReqHeader      Host: localhost
-   ReqHeader      User-Agent: curl/7.64.0
-   ReqHeader      Accept: */*
-   ReqHeader      X-Forwarded-For: 127.0.0.1
-   ReqAcct        73 0 73 268 540 808
The ReqStart tag lets us know what the IP address and port number of
the client is. The a0 refers to the socket that was used to connect.
This socket is defined using the -a startup parameter.
The ReqMethod tag indicates a regular HTTP GET request, and the
ReqURL shows that this request happened on the / URL.
The HTTP protocol version for this request was HTTP/1.1, as
indicated by the ReqProtocol tag.
A set of ReqHeader tags are used to list the request headers that were
passed with this HTTP request.
Finally, the ReqAcct tag is there to provide request accounting
information. Here’s the format of this tag, which will allow us to
explain the meaning of ReqAcct from our example:
%d %d %d %d %d %d
|  |  |  |  |  |
|  |  |  |  |  +- Total bytes transmitted
|  |  |  |  +---- Body bytes transmitted
|  |  |  +------- Header bytes transmitted
|  |  +---------- Total bytes received
|  +------------- Body bytes received
+---------------- Header bytes received
What this means in our example is that the incoming request contained 73 bytes of request headers, and no request body, which results in a total incoming byte count of 73 bytes.
The response contained 268 bytes of response header data, and 540
bytes of body payload. This body payload size will also be reflected in
the Content-Length response header.
The total number of transmitted bytes is 808.
Whenever there’s an HTTP request, there must an HTTP response. The response tags are responsible for displaying information about the HTTP response that was generated by Varnish.
Here’s the list of response tags:
RespProtocol: the HTTP version that is used in the responseRespStatus: the HTTP response status code of the responseRespReason: the response-reason phrase that clarifies the statusRespHeader: a set of response headers that were returnedHere’s a short example of a response containing the response tags that were mentioned:
-   RespProtocol   HTTP/1.1
-   RespStatus     200
-   RespReason     OK
-   RespHeader     Content-Type: text/html
-   RespHeader     Content-Encoding: gzip
-   RespHeader     X-Varnish: 2
-   RespHeader     Age: 1000
We know the response was made using the HTTP/1.1 protocol, as
indicated in by the RespProtocol tag. The response was a regular
200 OK. The RespStatus and RespReason will return this
information. And finally, there is a set of RespHeader tags that
contains the HTTP response headers that were returned.
In this case two response headers were injected by Varnish:
Age: how long the object has been in cacheX-Varnish: the VXID of the transactionThe backend tags are used when a miss or pass occurs, and a connection needs to be established with the origin server.
Here’s an example:
-   BackendOpen    31 boot.default 172.22.0.2 8080 172.22.0.3 45378
-   BackendStart   172.22.0.2 8080
-   BackendClose   31 boot.default
The BackendOpen tag provides information about the TCP or UDS
connection that is established with the backend. Here’s the format of
the tag:
%d %s %s %s %s %s
|  |  |  |  |  |
|  |  |  |  |  +- Local port
|  |  |  |  +---- Local address
|  |  |  +------- Remote port
|  |  +---------- Remote address
|  +------------- Backend display name
+---------------- Connection file descriptor
In our example file descriptor 31 is used for the backend, and the
actual backend that was selected came from a VCL configuration named
boot. Inside that VCL configuration a backend named default was
used.
You’ll agree that this is a very standard situation.
The connection with the origin was done via IP address 172.22.0.2 on
port 8080. The connection originated from IP address 172.22.0.3, and
the source port was 45378. The BackendStart tag provides similar
information and doesn’t add that much value.
However, it is interesting to see that a BackendClose tag was found.
This means the connection was not recycled for future requests to this
backend.
If keep-alive was enabled, the origin would return a
Connection: Keep-Alive header, and Varnish would reuse that
connection. This would result in the BackendReuse tag to appear in
VSL, as illustrated below:
- BackendReuse 31 boot.default
When a backend is opened, the goal is the send a backend request. The backend request tags are there to provide information about the backend request.
In most cases, the backend request will be identical to the client request. However, VCL does allow you to change request information, which might be reflected in the backend request.
These are the backend request tags:
BereqMethodBereqURLBereqProtocolBereqHeaderBereqAcctThis probably needs further explanation.
Just like regular response tags, there are also backend response tags. These are displayed when the response wasn’t served from cache but required a backend request.
These are the tags, and they look very similar to regular response tags:
BerespProtocolBerespStatusBerespReasonBerespHeaderAgain, this needs further explanation.
ObjProtocolObjStatusObjReasonObjHeaderSo far we’ve focused on input and output:
Although this is very useful, we also need to focus on what happens within Varnish.
Luckily, there are some VCL-related tags that do just that. Here’s a list of those tags:
VCL_Error: returns the error message in case of a VCL execution
failureVCL_Log: custom log messages that were logged via std.log() in
VCLVCL_acl: evaluation of ACLs in VCLVCL_call: the name of the VCL state that is currently being
executedVCL_return: the return statement that was used to transition to
the next stateVCL_use: the name of the VCL configuration that is being usedHere’s an example containing some VCL tags:
*   << Request  >> 2
-   VCL_call       RECV
-   VCL_return     hash
-   VCL_call       HASH
-   VCL_return     lookup
-   VCL_call       MISS
-   VCL_return     fetch
-   Link           bereq 3 fetch
-   VCL_call       DELIVER
-   VCL_return     deliver
**  << BeReq    >> 3
--  VCL_use        boot
--  VCL_call       BACKEND_FETCH
--  VCL_return     fetch
--  VCL_call       BACKEND_RESPONSE
--  VCL_return     deliver
If you remember the VCL flow from earlier in the book, you’ll notice that this log extract represents a cache miss.
The VCL_call tags go from RECV, to HASH, to MISS, to
BACKEND_FETCH, to BACKEND_RESPONSE, to DELIVER. The VCL_return
tags are responsible for this sequence of VCL subroutines being
called.
As mentioned before, a cache miss is not necessarily a bad thing. It’s just a cache hit that hasn’t happened yet. And as you can see in the log extract below, the next request will result in a lot less output:
*   << Request  >> 5
-   VCL_call       RECV
-   VCL_return     hash
-   VCL_call       HASH
-   VCL_return     lookup
-   VCL_call       HIT
-   VCL_return     deliver
-   VCL_call       DELIVER
-   VCL_return     deliver
This is because this sequence of events represents a cache hit. No
need to open up a << BeReq >> transaction and fetch data from the
backend because the object can be served from cache.
The VCL_acl tag can contain the following information when an ACL
wasn’t successfully matched:
- VCL_acl NO_MATCH purge
In this case an ACL named purge couldn’t match the IP address of the
client.
The next example reflects a successful ACL match on the purge ACL
for a client whose client.ip value could be matched to localhost:
- VCL_acl MATCH purge "localhost"
If you can, use std.log() in your VCL to log custom messages. Here’s
some VCL that was used to log ACL mismatches with some extra
information:
std.log(client.ip + " didn't match the 'purge' ACL");
This log line appears in VSL via a VCL_Log tag.
- VCL_Log 172.28.0.1 didn't match the 'purge' ACL.
And if you have multiple VCL configurations registered in Varnish,
the VCL_use tag will remind you which ones were being executed.
Here’s the standard value for that tag:
--- VCL_use boot
If you didn’t register any extra VCL files, boot would be the one
that was used when varnishd was booted.
When an error occurs within your VCL configuration, the VCL_Error
tag is displayed, containing the error that occurred.
Here’s an example where too many levels of ESI were used:
-6- VCL_Error ESI depth limit reach (param max_esi_depth = 5)
The timestamp tag is very important, as it shows how long individual
aspects of the HTTP request took.
Here’s the format of this tag:
%s: %f %f %f
|   |  |  |
|   |  |  +- Time since last timestamp
|   |  +---- Time since start of work unit
|   +------- Absolute time of event
+----------- Event label
Here’s an example of the timing for a typical request that resulted in a cache miss:
*   << Request  >> 11
-   Timestamp      Start: 1606398588.811189 0.000000 0.000000
-   Timestamp      Req: 1606398588.811189 0.000000 0.000000
-   Timestamp      Fetch: 1606398588.818399 0.007210 0.007210
-   Timestamp      Process: 1606398588.818432 0.007243 0.000032
-   Timestamp      Resp: 1606398588.818609 0.007421 0.000178
**  << BeReq    >> 12
--  Timestamp      Start: 1606398588.811381 0.000000 0.000000
--  Timestamp      Bereq: 1606398588.814423 0.003042 0.003042
--  Timestamp      Beresp: 1606398588.817982 0.006601 0.003559
--  Timestamp      BerespBody: 1606398588.818372 0.006991 0.000390
Different aspects of the execution flow are timed:
Start: when did the request start?Req: how long after the start did we receive the request?Fetch: in the case of a miss, how long did the fetch take?Process: how long did the processing of the backend response take?Resp: how long until we can return the response to the client that
requested it?The same applies to the << BeReq >> transaction:
Start: when did the backend request start?Bereq: how long after the start did we send out the backend
request?Beresp: how long did it take for the backend response to arrive?BerespBody: how long until we processed the response body from the
backend response?The Unix timestamps in the second column gives you the exact time when each measurement took place with microsecond precision. However, we care more about the duration than the absolute time of execution.
The third column is the total time of execution since the start, and the fourth is the duration of this specific unit of work.
In our example it took the backend 72 milliseconds to respond, and it took Varnish a little over 74 milliseconds to return the response. But the individual task of returning the response to the client only took 178 microseconds.
For a cached object, the following logs could be generated:
*   << Request  >> 14
-   Timestamp      Start: 1606399284.176260 0.000000 0.000000
-   Timestamp      Req: 1606399284.176260 0.000000 0.000000
-   Timestamp      Process: 1606399284.176393 0.000133 0.000133
-   Timestamp      Resp: 1606399284.176648 0.000388 0.000255
Because this was a cache hit, there is no Fetch timestamp tag.
There’s also no << BeReq >> transaction. The total execution time of
the request is a mere 388 microseconds.
Earlier in this book, we explained extensively how the TTL of an object is calculated:
All this information can be found in the TTL tag. Here’s its format:
%s %d %d %d %d [ %d %d %u %u ] %s
|  |  |  |  |    |  |  |  |    |
|  |  |  |  |    |  |  |  |    +- "cacheable" or "uncacheable"
|  |  |  |  |    |  |  |  +------ Max-Age from Cache-Control header
|  |  |  |  |    |  |  +--------- Expires header
|  |  |  |  |    |  +------------ Date header
|  |  |  |  |    +--------------- Age (incl Age: header value)
|  |  |  |  +-------------------- Reference time for TTL
|  |  |  +----------------------- Keep
|  |  +-------------------------- Grace
|  +----------------------------- TTL
+-------------------------------- "RFC", "VCL" or "HFP"
Let’s throw in a couple of examples to show the different values.
Here’s the first one:
-- TTL RFC 120 10 0 1606398419 1606398419 1606398419 0 0 cacheable
This object is cacheable and is stored in the cache for 120 seconds.
Because it is cacheable, it is definitely not a HFP object. But
because no Expires or Cache-Control header was set, Varnish will
fall back on its default_ttl value, which is set at two minutes.
Also interesting to note is that ten seconds of grace was added but no extra keep time.
Here’s another cacheable response:
-- TTL RFC 25 10 0 1606400425 1606400425 1606400425 0 25 cacheable
The TTL for this example was set to 25 seconds, and that was because
the max-age value of the Cache-Control header was set to 25.
Here’s an example of a hit-for-miss object being created after a
Cache-Control: private, no-cache, no-store header was received:
-- TTL VCL 120 10 0 1606400537 uncacheable
For the next two minutes, all requests for this object will bypass the waiting list and will directly hit the backend. If in the meantime a cacheable response is returned, a regular object is inserted.
The more aggressive version of this is hit-for-pass. The following
example is uncacheable for the same reasons but because
return(pass(10s)); was added as an explicit return statement, the
hit-for-miss is turned into a hit-for-pass:
-- TTL HFP 10 0 0 1606402666 uncacheable
The TTL value is ten seconds because of the fact that this duration
was explicitly used in return(pass(10s));.
In the final TTL example, we’ll juice up grace and keep a bit:
-- TTL RFC 500 10 0 1606403184 1606403184 1606403183 0 500 cacheable
The Cache-Control header had a max-age value of 500 seconds; we
set the grace to an hour, and the keep to a day.
The fact that we set the TTL via an HTTP header turned this into an
RFC log item.
Now that we’ve familiarized ourselves with the various VSL tags, it’s time to put these tags to use.
If you run varnishlog on a production server, you’ll be overwhelmed by
the amount of output coming your way. By filtering out specific tags,
the information is easier to process.
The -i parameter in varnishlog will only include the tags that were
mentioned.
Here’s a standard example, where we want to know the URL of a request and its flow through the finite state machine:
$ varnishlog -i ReqUrl,VCL_call,VCL_return -g session
This example will only include the ReqUrl, VCL_call, and
VCL_return tags for transactions that were grouped by session:
*   << Session  >> 1
**  << Request  >> 2
--  ReqURL         /
--  VCL_call       RECV
--  VCL_return     hash
--  VCL_call       HASH
--  VCL_return     lookup
--  VCL_call       MISS
--  VCL_return     fetch
--  VCL_call       DELIVER
--  VCL_return     deliver
*** << BeReq    >> 3
--- VCL_call       BACKEND_FETCH
--- VCL_return     fetch
--- VCL_call       BACKEND_RESPONSE
--- VCL_return     deliver
As you can see, the homepage was consulted but was not served from cache. A backend fetch was required.
A very common example, and thanks to output filtering, the logs are easier to interpret.
Wildcards are also supported. Our previous example can even be rewritten as follows:
$ varnishlog -i "ReqUrl,VCL_*" -g session
You can also exclude tags from the output. This is done by using the
-x parameter.
Here’s an example where we include all tags that start with Req, but
we want to exclude the ReqHeader and ReqUnset tags:
$ varnishlog -i "Req*" -x ReqHeader,ReqUnset
And here’s the output:
-   ReqStart       172.28.0.1 52280 http
-   ReqMethod      GET
-   ReqURL         /
-   ReqProtocol    HTTP/1.1
-   ReqAcct        140 0 140 294 608 902
Basic tag inclusion and exclusion is already a step in the right direction. But some tags have many occurrences in a single transaction.
Take for example a request where you only care about the
Accept-Language header. Including ReqHeader can create a lot of
noise.
The solution is to filter out tags by value. The -I uppercase
parameter does just that.
The following example retrieves the URL of the request and the
Accept-Language header:
$ varnishlog -g request -i ReqUrl -I ReqHeader:Accept-Language
Here’s the output for the next request:
-   ReqURL         /
-   ReqHeader      Accept-Language: en-US,en;q=0.9,nl;q=0.8,nl-NL;q=0.7
If it weren’t for the -I parameter, you’d get a lot more irrelevant
output, even if you use -i.
Whereas -I includes tags by matching the value, the same thing can be
done for exclusion. The -X uppercase parameter can be used to exclude
tags based on a regular expression.
Here’s an example where we include the ReqUrl and RespHeader tags,
but we exclude all response headers that start with an X, both
uppercase and lowercase:
$ varnishlog -g request -i ReqUrl -i RespHeader -X "RespHeader:(X|x)-"
Here’s the output for the next request:
*   << Request  >> 5
-   ReqURL         /
-   RespHeader     Content-Type: application/json; charset=utf-8
-   RespHeader     Content-Length: 539
-   RespHeader     ETag: W/"21b-faj3J9Bg0wmX965fRcvtQFqPZr4"
-   RespHeader     Date: Fri, 27 Nov 2020 09:19:48 GMT
-   RespHeader     Age: 99
-   RespHeader     Accept-Ranges: bytes
-   RespHeader     Connection: keep-alive
The X-Varnish response header is removed from this transaction,
possibly along with some other headers that were sent by the origin
that started with an X.
Unless the -c or -b flags were added to varnishlog, both
<< Request >> and << BeReq >> transactions are included in the
output.
However, you can filter out entire transactions:
-c
parameter.-b
parameter.Using both
-cand-bwill include both types of requests, but that has the same effect as not mentioning them at all.
The following example will list both the URL that was provided by the
client, and the URL that was sent to the origin. However, the -c
flag will prevent the << BeReq >> transaction from being included in
the output:
$ varnishlog -g request -c -i ReqUrl -i BereqUrl
Here’s the output:
*   << Request  >> 12
-   ReqURL         /
Let’s end the output filtering subsection with an all-in-one example that uses all filtering techniques.
Here’s the varnishlog command:
$ varnishlog -c -g request -i Req* -i Resp* \
	-I Timestamp:Resp -x ReqAcct -x RespUnset \
	-X "RespHeader:(x|X)-(url|host)"
And before we display the log information, we need to add some context to the story.
The VCL for this example adds two custom response headers: x-url and
x-host. Before delivering the content to the client, these headers are
stripped off again.
If you remember asynchronous bans from chapter 6, you’ll know that request context needs to be injected in the response object; otherwise the ban lurker cannot ban objects based on the URL and hostname.
As a reminder, here’s the VCL that adds and removes these headers:
sub vcl_backend_response {
	set beresp.http.x-url = bereq.url;
	set beresp.http.x-host = bereq.http.host;
}

sub vcl_deliver {
	unset resp.http.x-url;
	unset resp.http.x-host;
}
These actions are also reported in VSL through RespHeader and
RespUnset tags. The RespUnset tag reports response tags being
removed.
But we don’t want our VSL output to be polluted with this kind of
information, hence the -x RespUnset and
-X "RespHeader:(x|X)-(url|host)" parameters.
With that in mind, here’s the output:
*   << Request  >> 1
-   ReqStart       172.18.0.1 38076 http
-   ReqMethod      GET
-   ReqURL         /
-   ReqProtocol    HTTP/1.1
-   ReqHeader      Host: localhost
-   ReqHeader      User-Agent: curl/7.64.1
-   ReqHeader      Accept: */*
-   ReqHeader      X-Forwarded-For: 172.18.0.1
-   RespProtocol   HTTP/1.1
-   RespStatus     200
-   RespReason     OK
-   RespHeader     Content-Type: application/json; charset=utf-8
-   RespHeader     Content-Length: 555
-   RespHeader     ETag: W/"22b-nCrko0g3BQi5EC4Z9AcxPigbGms"
-   RespHeader     Date: Fri, 27 Nov 2020 09:40:46 GMT
-   RespHeader     X-Varnish: 65543
-   RespHeader     Age: 100
-   RespHeader     Via: 1.1 varnish (Varnish/6.0)
-   RespHeader     Accept-Ranges: bytes
-   RespHeader     Connection: keep-alive
-   Timestamp      Resp: 1606470046.159483 0.003742 0.000081
The log output gives us request information, response information, and the total duration of execution.
So far we’ve been filtering output and have only been displaying the tags we care about. This definitely decreases the amount of log lines in the output.
But there’s still the potential for noise. Although we’ve been reducing the size of the transactions, we’re still displaying all transactions.
In this section we’re going to apply VSL queries to include only transactions that match specific criteria.
The -q parameter will allow us to specify a query. The syntax for VSL
queries goes as follows:
<record selection criteria> <operator> <operand>
Yes, this is quite vague. An example will make this make more sense. Here it is:
$ varnishlog -i VCL_call -i VCL_return -q "ReqUrl eq '/'"
This varnishlog command will display the VCL flow by including
VCL_call and VCL_return tags, but only for the homepage, that is,
only when the ReqUrl tags is equal to /.
If we refer back to the VSL query syntax, we can break this down as follows:
ReqUrl is part of the record selection criteria.eq is the operator.'/' is the operand.The record selection criteria can be a lot more elaborate than what we just showed you. Here’s the syntax for these criteria:
{level}taglist:record-prefix[field]
The {level} syntax refers to the transaction hierarchy in VSL.
Here’s a diagram that clarifies these levels:
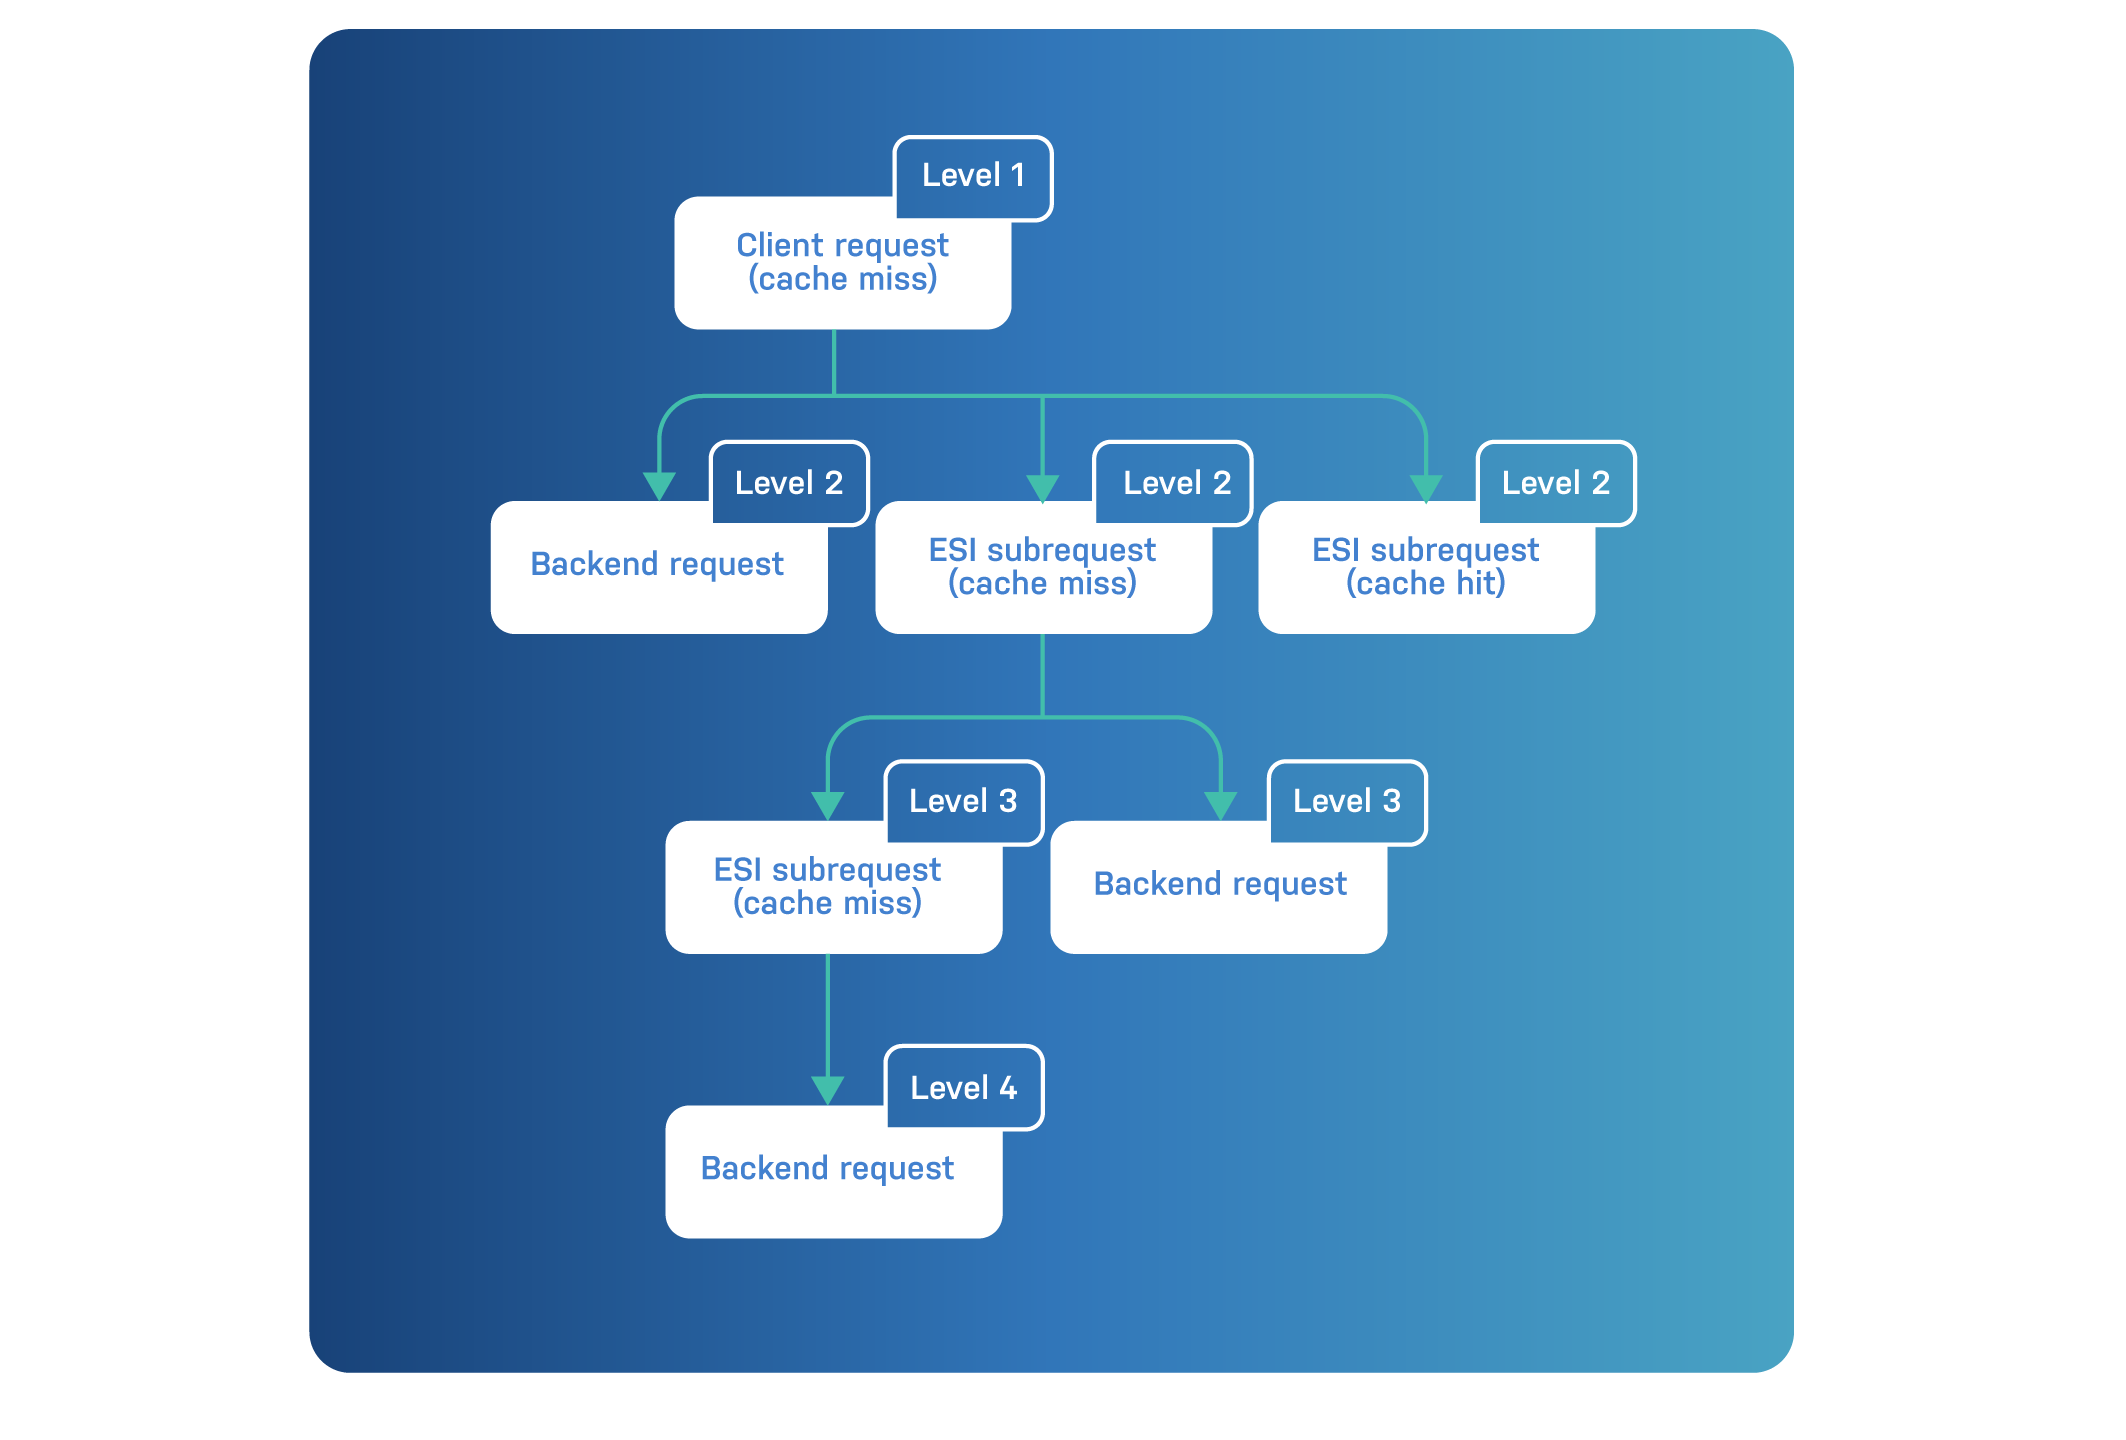
These levels only apply when request grouping takes place. And the level 1 transaction is the client request.
When a cache miss takes place, a level 2 transaction appears in the logs. This contains a backend request, but at the same time can also contain a set of ESI subrequests.
In the diagram, we’ve made a distinction between ESI subrequests that resulted in a cache hit or a cache miss.
For ESI subrequests that cause a cache miss, a level 3 backend request is required. Maybe that ESI subrequest triggers another ESI subrequest.
If that level 3 ESI subrequest also results in a cache miss, a level 4 backend request is triggered.
This can go on and on until you hit the max_esi_depth limit. The
default value for the max_esi_depth runtime parameter is currently
five.
The taglist directive refers to one tag or a glob pattern that
matches multiple tags.
If a transaction has multiple occurrences of a tag, the record-prefix
can be used to single out log lines that match the prefix.
And if you want to match specific values from individual fields in a log
line, the [field] syntax can be used.
This is a lot of information to digest. Let’s throw in an example that uses the full syntax:
varnishlog -c -i ReqUrl -I Timestamp:Resp -g request -q "{2+}Time*:Resp[2] > 2.0"
This example will only display transactions that have subtransactions. The number of levels doesn’t matter as long as it is more than two.
For these transactions, only the client-side transaction is shown, and only the request URL and timestamp are displayed for responses that took longer than two seconds to generate.
Let’s break down the query:
{2+}: the query applies to transactions at level 2 or greaterTime*: a glob pattern that matches all tags that start with Time:Resp: refers to prefixes of log lines that match Resp for these
tags[2]: looks at the second field of a matched log line> 2.0: ensures that value is greater than twoAnd let’s have a look at parameters as well:
-c: only displays client-side transactions-i ReqUrl: displays the URL of the request-I Timestamp:Resp: displays Timestamp tags that have a Resp
prefix-g request: groups the transactions by request-q: performs a VSL query, and only displays transactions that
match the queryThis could be the output of the varnishlog command:
*   << Request  >> 13
-   ReqURL         /
-   Timestamp      Resp: 1606733707.261102 3.012484 3.007354
**  << Request  >> 15
--  ReqURL         /esi
--  ReqURL         /esi
--  Timestamp      Resp: 1606733707.260886 3.006929 0.000161
As we can see, the / page takes more than three seconds to load and
that is because the /esi subrequest took so long to load.
We’ve already seen some VSL query examples that feature both string comparison and numerical comparison.
For the sake of completeness, here’s a list of the operators that are supported by the VSL query syntax:
==: the operand numerically equals the record value!=: the operand doesn’t numerically equal the record value<: the operand is greater than the record value<=: the operand is greater than or equal to the record value>: the operand is less than the record value>=: the operand is less than or equal to the record valueeq: the operand equals the record string valuene: the operand doesn’t equal the record string value~: the record value matches the regular expression pattern!~: the record value doesn’t match the regular expression patternWe’ve already covered the record selection criteria, and we listed the operators. We just need to talk about operands, which is very straightforward.
There are four types of operands:
Let’s have an example for each operand type. Here’s the one for the integer type:
$ varnishlog -g request -q "BerespStatus >= 500"
This example will only show transactions whose status code is greater than or equal to 500. This implies retrieving server errors.
Here’s the float example:
$ varnishlog -g request -q "Timestamp:Resp[2] > 2.0"
This example command looks familiar and was already featured. Just remember that the timestamps have microsecond precision and are expressed as floating point numbers.
The string example is also quite simple:
$ varnishlog -g request -q "ReqUrl eq '/'"
This example will only show transactions for the homepage.
And here’s the regular expression example:
$ varnishlog -g request -q "ReqUrl ~ '^/contact'"
This example will match all transactions that start with /contact.
This also includes requests for a URL like /contact-page.
You may wonder why booleans aren’t included in the list of types. This is because transactions don’t have boolean values. However, boolean comparisons are supported.
Here’s an example of a boolean comparison:
$ varnishlog -g request -q "ReqHeader:Accept-Language"
This query will include all transactions that have an Accept-Language
request header. The exact opposite is also supported by adding the not
keyword:
$ varnishlog -g request -q "not ReqHeader:Accept-Language"
This example will include all transactions that do not have an
Accept-Language request header.
All the VSL query examples we’ve featured so far used a single comparison.
Multiple comparisons are supported, and queries can be chained using the
and boolean function, or the or boolean function.
Here’s an example that combines two comparisons:
$ varnishlog -c -i ReqUrl -I RespHeader:Content-Type \
	-i reqacct -g request \
	-q "RespHeader:Content-Type ~ '^image/' and ReqAcct[5] >= 2000000"
This example will display the URL, Content-Type header, and request
handling byte counts for all transactions where the Content-Type
response header matches the ^image/ pattern, and the number of bytes
returned by the body is greater than 2 MB.
Long story short: we’re displaying transactions for images larger than 2 MB.
Here’s the potential output:
*   << Request  >> 65562
-   ReqURL         /image.jpg
-   RespHeader     Content-Type: image/jpeg
-   ReqAcct        82 0 82 311 2832889 2833200
As you can see, the Content-Type header is image/jpeg, which matches
the regular expression. And also the fifth field of the ReqAcct tag is
2832889, which is more than 2 MB. The combination of these two
comparisons results in the output.
Here’s an example where the or boolean function is used to chain
comparisons:
$ varnishlog -c -g request -i ReqUrl \
	-I VCL_call:PASS -I VCL_call:MISS \
	-q "VCL_call eq 'MISS' or VCL_call eq 'PASS'"
This example will show the URL and MISS/PASS status for all requests that are cache misses, or where the cache is bypassed.
Here’s the potential output for such a query:
*   << Request  >> 10
-   ReqURL         /
-   VCL_call       MISS
*   << Request  >> 525
-   ReqURL         /account
-   VCL_call       PASS
And finally, parentheses can be used when and and or are combined.
Here’s an example where we use parentheses for this:
$ varnishlog -c -g request -i ReqUrl \
	-q "TTL[6] eq 'uncacheable' and (BerespHeader:Set-Cookie or BerespHeader:Cache-Control ~ '(private|no-cache|no-store)')"
This example will display the URL of the corresponding request for
uncacheable responses that were caused by the presence of a Set-Cookie
response header, or the fact that the Cache-Control response header
contained non-cacheable directives.
Up until this point we primarily focused on filtering and querying
options. Tools like varnishlog, varnishtop, and varnishncsa also
have some other useful options, which we’ll discuss now.
We’ll primarily apply them to
varnishlog, butvarnishtopandvarnishncsawill also covered separately.
When VSL programs are run, input is collected from the moment the program is started. However, there is already a lot more information in the VSL circular buffer.
By adding the -d option to varnishlog, varnishtop, or
varnishncsa, the output starts at the head of the log and exits.
Here are the corresponding examples:
$ varnishlog -i ReqUrl -d
$ varnishtop -i ReqUrl -d
$ varnishcsa -d
The -d option is useful for getting the full picture. The size of the
VSL space is controlled by the -l option for varnishd, and as stated
previously the default size is 80 MB. The bigger you set this, the
more information is held in this buffer.
Here’s an example where you get the URL and starting timestamp for
all transactions in the VSL buffer that started at
1/12/2020 11:00:00 UTC or later:
$ varnishlog -g request -i requrl -d \
	-q "Timestamp:Start[1] >= $(date -d '1/12/2020 11:00:00' +%s.0)"
The $(date -d '1/12/2020 11:00:00' +%s.0) subcommand was used to
convert the date and time into the Unix timestamp format that is used
by the Timestamp tag.
Dumping the contents of the buffer is a lot more interesting when you
aggregate the data using varnishtop:
varnishtop -i ReqUrl -d -1
In this example the top request URLs are computed. -d will dump the
buffer and use this as input. The -1 ensures the computation only
happens once, and the output is sent to standard output, instead of
constantly being refreshed.
This is the potential output:
6582.00 ReqURL /
3920.00 ReqURL /contact
2640.00 ReqURL /products
The homepage is by far the most popular page with an average request rate of 6582 requests per second.
Here’s an extract of the output if varnishncsa -d is used to process
the VSL buffer:
192.168.0.1 - - [01/Dec/2020:12:11:31 +0000] "GET http://localhost/products HTTP/1.1" 200 6 "-" "curl/7.64.1"
192.168.0.1 - - [01/Dec/2020:12:11:31 +0000] "GET http://localhost/contact HTTP/1.1" 200 6 "-" "curl/7.64.1"
192.168.0.1 - - [01/Dec/2020:12:11:31 +0000] "GET http://localhost/products HTTP/1.1" 200 6 "-" "curl/7.64.1"
192.168.0.1 - - [01/Dec/2020:12:11:31 +0000] "GET http://localhost/contact HTTP/1.1" 200 6 "-" "curl/7.64.1"
192.168.0.1 - - [01/Dec/2020:12:11:31 +0000] "GET http://localhost/contact HTTP/1.1" 200 6 "-" "curl/7.64.1"
192.168.0.1 - - [01/Dec/2020:12:11:31 +0000] "GET http://localhost/contact HTTP/1.1" 200 6 "-" "curl/7.64.1"
192.168.0.1 - - [01/Dec/2020:12:11:31 +0000] "GET http://localhost/contact HTTP/1.1" 200 6 "-" "curl/7.64.1"
192.168.0.1 - - [01/Dec/2020:12:11:31 +0000] "GET http://localhost/products HTTP/1.1" 200 6 "-" "curl/7.64.1"
This output is different from varnishlog because it formats it in
Apache/NCSA format. This format is suitable for access logs.
VSL is extremely verbose. Running a tool like varnishlog on a
production server will become somewhat overwhelming.
Tag filtering and using VSL queries to reduce the output will only get you so far. On busy systems where a lot of transactions meet the querying criteria, there will still be tons of output.
If you don’t need every single log line to get the required insight, you can opt to use rate limiting.
The -R uppercase parameter will limit the number of transactions that
are returned based on a ratio.
Here’s an example where only ten transactions per minute are displayed:
varnishlog -g request -R 10/1m
The format of -R is <number-of-requests>/<duration>. The duration
is expressed as a VCL duration type. This includes the numerical value
and the time unit suffix.
The same limits can be imposed on a varnishncsa command, as
illustrated below:
$ varnishncsa -R 10/1m
Rate limiting is not available for varnishtop, which makes sense. The
varnishtop program aggregates the output and is not that noisy. The
results would be heavily skewed if rate limiting were to be applied.
The output from varnishlog can be stored in a file. This can either be
done in a human-readable format for analysis later on, but we can also
store it in a binary format.
Logs in binary format can be replayed in varnishlog where filters and
queries can be applied after the fact.
The easiest way to store the log in a file is by running the following command:
$ varnishlog -w vsl.log
As long as the command is running, VSL logs will be stored in
vsl.log. When this command is run again, vsl.log will be
overwritten.
The logs are persisted in a binary format, which makes replaying them quite easy.
Replaying those logs is done using the following command:
$ varnishlog -r vsl.log
And as mentioned before, queries and filters can be applied. Here’s an example:
$ varnishlog -i ReqUrl -i ReqAcct \
	-q "RespHeader:Content-Type ~ '^(image|video)/'" \
	-r vsl.log
This example will read vsl.log and will find all transactions where
the Content-Type header of the response matches images and video
files. For those transactions the URL and the byte count sizes are
returned.
When you want to ensure that your log file is not overwritten every time
the varnishlog -w vsl.log is called, you can use the -a parameter.
This parameter ensures that data is appended to the log file every time
the command is called.
Remember that anything filtered out when writing log files will be
missing during replay. We advise you not to use the -i and -I
options in this situation, and just let varnishlog write the complete
transaction.
VSL queries are allowed, but the full transaction is expected to be
written to file. Please also watch out what kind of transaction
grouping you use. If you use -g request, please understand that
session grouping is not supported when you replay the logs because you
are effectively filtering sessions out.
The -g raw grouping is the fastest one and can be useful to increase
write throughput, but it also increases the chance of collecting partial
transactions that wouldn’t be useful during replay. Since raw grouping
will capture both transactional and non-transactional logs, you might
want to clarify this with a query. For example to only collect
non-transactional logs:
$ varnishlog -g raw -q 'vxid == 0'
If you don’t care about log replaying and applying filters and queries
after the fact, you can also store varnishlog output in ASCII
format. Just add the -A uppercase parameter to make this happen.
Remember that you will lose the ability to perform structured querying
or filtering.
Let’s revisit the example where we’re inspecting the URL and byte count
sizes for images and video files, and append that information in a
human-readable format to vsl.log:
$ varnishlog -i ReqUrl -i ReqAcct \
	-q "RespHeader:Content-Type ~ '^(image|video)/'" \
	-w vsl.log -a -A
We spent a lot of time talking about varnishlog. It’s an important
tool, maybe even the most important logging tool in our toolkit.
But let’s not forget that varnishncsa is also a very powerful tool.
Perhaps not as verbose as varnishlog, but the advantage of
varnishncsa is usually a single-line, concise output*.
This output is formatted in the Apache/NCSA combined format. This is what the format looks like by default:
%h %l %u %t "%r" %s %b "%{Referer}i" "%{User-agent}i"

- `%h`: the hostname or IP address of the remote host
- `%l`: remote log name
- `%u`: remote authenticated user
- `%t`: time when the request was received
- `%r`: first line of the HTTP request
- `%s`: HTTP status code of the response
- `%b`: size of the response body in bytes
- `%{Referer}i`: the `Referer` request header
- `%{User-Agent}i`: the `User-Agent` request header
Here’s some potential output in this format:
192.168.0.1 - - [01/Dec/2020:13:45:23 +0000] "GET http://localhost/ HTTP/1.1" 200 6 "-" "curl"
By default varnishncsa will only output client transactions. That is
because varnishncsa is there to replace your regular web server logs.
Because of caching and the fact that requests are offloaded from the
origin server, the logs you usually consult will remain mostly empty.
The higher the hit rate of your cache, the lower the number of log
lines.
Standard NCSA-style log files are stored on disk. By default
varnishncsa just consults the VSL circular memory buffer, so there
is no disk access.
It is quite common to store varnishncsa output on disk. Here’s an
example:
$ varnishncsa -a -w /var/log/varnish/access.log
If your pre-Varnish setup used log analysis or log centralization
tools, varnishncsa log files are an excellent surrogate.
As mentioned, the standard logging mode will only output client
transactions. It is possible to display backend transactions by
adding the -b parameter to varnishncsa.
If you want to combine client and backend transactions in your output,
you can add both the -c and -b parameters. However, the output may
be confusing.
You can add the %{Varnish:side}x formatter to your output. This
formatter will return c for client requests and b for backend
requests.
This is the corresponding command to create that sort of output:
$ varnishncsa -c -b -F '%h %l %u %t "%r" %s %b "%{Referer}i" "%{User-agent}i" "%{Varnish:side}x"'
And here’s some example output for this command:
172.18.0.3 - - [02/Dec/2020:10:18:38 +0000] "GET http://localhost/HTTP/1.1" 200 6 "-" "curl" "b"
127.0.0.1 - - [02/Dec/2020:10:18:38 +0000] "GET http://localhost/ HTTP/1.1" 200 6 "-" "curl" "c"
As you can see the %h formatter that outputs the remote host is
different for each of the lines. Their meaning is also a bit different,
depending on the mode:
%h formatter refers to the IP address of the
backend server.%h formatter refers to the IP address of the
client.There’s also a difference in meaning for the %b formatter:
%b formatter refers to the number of bytes
received from the backend for the response body.%b formatter refers to the total byte size of
the response for the response body.If the response body is modified in VCL, these counters can have a different value.
The standard format for varnishncsa is the NCSA combined log format.
We’ve described the format earlier. It is a conventional format that
most log analyzers support.
However, you’re not obligated to respect that format. For the sake of completeness, here is list of all supported formatters:
| Formatter | Meaning |
|---|---|
%b |
Size of the response body in bytes |
%D |
Time taken to serve the request in microseconds |
%H |
The request protocol |
%h |
The hostname or IP address of the remote host |
%I |
Total bytes received |
%{X}i |
Contents of request header X |
%l |
Remote log name |
%m |
Request method |
%{X}o |
Contents of response header X |
%O |
In client mode, total bytes sent to client. In backend mode, total bytes received from the backend |
%q |
The query string |
%r |
First line of the HTTP request composed using other formatters |
%s |
HTTP status code of the response |
%t |
Time when the request was received |
%{X}t |
Time when request was received in the strftime time specification format |
%T |
Time taken to serve the request |
%U |
Request URL without query string |
%u |
Remote authenticated user |
%{X}``x |
Extended Varnish & VCL variables |
The -F parameter allows you to specify a format string. Here’s a
simple example:
$ varnishncsa -F '%U %T'
This format will return the URL of the request and the time in seconds it took to serve the request.
You can also save your log format in a file. If we revisit the example
where %{Varnish:side}x was added to the format, we could store the
following content in
/etc/varnish/varnishncsa_combined_and_side_formatter:
%h %l %u %t "%r" %s %b "%{Referer}i" "%{User-agent}i" "%{Varnish:side}x"
Loading this format can be done via the -f parameter, as illustrated
below:
$ varnishncsa -c -b -f /etc/varnish/varnishncsa_combined_and_side_formatter
This way you can store multiple formats in separate files and easily call them when required.
There are also some special formatters that allow you to inject headers and other special values.
Let’s have a look at headers first. The %{X}i formatter replaces the
X with a valid request header and returns its values. The same
applies to %{X}o, where the X is replaced with a valid response
header.
Here’s an example where we care about the URL, the Accept-Language
request header, and the Content-Type response header:
$ varnishncsa -F '%U "%{Accept-Language}i" "%{Content-Type}o"'
This is the output that is generated:
/ "en-US,en;q=0.9,nl;q=0.8,nl-NL;q=0.7" "text/html; charset=UTF-8"
And there is also another special one, which is %(X)t. This formatter
allows you to return the request time in a custom time format. As stated
in the table above, the strftime format is used. See the strftime(3)
manual on your system by running man 3 strftime for more information
about this format.
Here’s an example where we display the full date, including the day of the week, and the hour of the day:
varnishncsa -F '%{%A %B %-d %Y %-I %p}t'
Here’s some output we generated:
Wednesday December 2 2020 11 AM
Let’s break down the date format:
%A: the full name of the day of the week%B: the full month name%-d: the day of the month as a decimal number without the
zero-padding%Y: the year as a decimal number including the century%-I: the hour as a decimal number using a 12-hour clock without the
zero-padding%p: AM or PMThere is one type of formatter that deserves its own subsection. The
extended variables formatter, which uses the %{X}``x notation,
allows us to use specific variables and access VSL information. The
sky is the limit, basically.
Let’s look at the extended variables first before talking about VSL.
Here’s the list of variables that can be accessed:
Varnish:time_firstbyte: time until the first byte is returnedVarnish:hitmiss: hit/miss markerVarnish:handling: returns either hit, miss, pass, pipe, or
synth. Indicates how the request was handledVarnish:side: returns c when in client mode, and b when in
backend mode. We’ve already covered this one earlierVarnish:vxid: the Varnish transaction IDHere’s an example where Varnish:handling and Varnish:side are used.
It gives you some insight as to what happened behind the scenes for this
request.
Here’s the command:
$ varnishncsa -F '%U %{Varnish:handling}x %{Varnish:side}x' -b -c
In the example, two requests for /test are being sent. This is the
output:
/test - b
/test miss c
/test hit c
As you can see, the backend transaction doesn’t decide on the handling. However, the client transaction does and qualifies it as a cache miss. For the second request, there is not a backend transaction because it was a cache hit.
The next request contained a cookie, based on the built-in VCL, which resulted in a pass:
/test - b
/test pass c
The final request was made using an unrecognized request method. The built-in VCL uses piping to send that request to the backend. As you may remember, Varnish no longer considers this an HTTP request and shuffles the bytes directly to the origin.
Here’s the output:
/test - b
/test pipe c
And then there’s the VSL information we can include. According to the specification, this is the format:
VSL:tag:record-prefix[field]
This should look familiar to you.
Here’s a first example where we use %b to display the body bytes
that were transmitted. But thanks to %{VSL:ReqAcct[4]}x, we can also
display the header bytes that were transmitted:
$ varnishncsa -F "%b (body bytes) %{VSL:ReqAcct[4]}x (header bytes)"
This is the output:
3257 (body bytes) 276 (header bytes)
The following example will display the TTL, grace, and keep values for an object, along with its URL. Here’s the command:
varnishncsa -b -F "%U TTL: %{VSL:TTL[2]}x - Grace: %{VSL:TTL[3]}x - Keep: %{VSL:TTL[4]}x"
This is the output:
/ TTL: 100 - Grace: 10 - Keep: 0
VSL queries are not restricted to varnishlog. We can also use them
in varnishncsa to narrow down the scope of what we want to log.
Once you start adding queries, this is no longer a surrogate for regular
access logs. Chances are that you’ll be running multiple varnishncsa
services, depending on the things you want to log.
The -q parameter, which we covered extensively, is also used here. The
following example will log backend responses that took more than a
second to load:
$ varnishncsa -b -F '%{VSL:Timestamp:BerespBody[2]}x %{Host}i %U%q' -q 'Timestamp:BerespBody[2] > 1.0'
Here’s the output:
2.007142 localhost /
This example only outputs backend transactions when the query matches.
It would seem as though you have the same flexibility as with
varnishlog. An extra benefit is single-line output. However, you’re
very strictly tied to the mode you’re in.
Unless you combine -c and -b, there is no way to return backend
transaction information and client transaction information at the
same time. And if you do combine both modes, the output will be spread
across two lines.
Just like varnishlog, varnishncsa also had the well-known -w and
-a options to write and append logs to a file.
The -d option is also there to dump the entire VSL buffer and exit.
And unsurprisingly the -R option is there to perform rate limiting.
Transaction grouping via -g is also supported but is limited to
-g request and -g vxid.
You can even replay binary VSL logs from a file and present them in
NCSA combined format using the -r option.
This is all very similar to varnishlog and needs no further
explanation.
When you start logging incoming requests via varnishncsa, and these
logs end up being stored in files, we have to be careful. On busy
production systems, the size of these logs can become gigantic.
That’s why a proper log rotation strategy is in order. Log rotation ensures that logs are automatically archived to avoid running out of disk space.
A number of logs are kept, based on certain criteria. Given the
configured frequency, the current log file is moved and renamed, while
an empty log file is used by varnishncsa. When the maximum number of
log files is reached, the oldest one is removed. This is a cyclical
process.
When you install Varnish via packages, a log-rotate configuration is
available for varnishncsa.
This is what it looks like:
/var/log/varnish/varnishncsa.log {
  daily
  rotate 7
  compress
  delaycompress
  missingok
  postrotate
	systemctl -q is-active varnishncsa.service || exit 0
	systemctl reload varnishncsa.service
  endscript
}
This configuration is located in /etc/logrotate.d/varnish and is
picked up automatically by the logrotate program.
This configuration will perform daily log rotation and rotates as soon as seven log files exist.
This is what the directory layout will look like:
varnishncsa.log
varnishncsa.log.1
varnishncsa.log.2.gz
varnishncsa.log.3.gz
varnishncsa.log.4.gz
varnishncsa.log.5.gz
varnishncsa.log.6.gz
varnishncsa.log.7.gz
Log files will be compressed via gzip, and compression is delayed
until the next rotation. That’s why varnishncsa.log.1 is not
compressed.
The missingok directive makes sure that logrotate doesn’t complain
when a log file is missing.
The commands between postrotate and endscript are tasks that can be
performed after the log rotation. In our case, it is important to signal
to varnishncsa that it can release the log file and reopen it.
Otherwise varnishncsa will still attempt to write to the original
file.
By sending a SIGHUP signal to the varnishncsa process, it will
release and reopen. This requires prior knowledge about the process ID
of the varnishncsa process.
If you were to manually run varnishncsa as a daemon, you could specify
the -P parameter to write the process ID to a file.
Here’s an example of running varnishncsa as a service but without a
proper service manager supporting it:
$ varnishncsa -a -D -w /var/log/varnish/access.log -P /var/run/varnishncsa.pid
The -D parameter will daemonize the process and -P will write the
PID file to /var/run/varnishncsa.pid.
You can use the following postrotate command:
postrotate
  kill -HUP $(cat /var/run/varnishncsa.pid)
endscript
This basically sends a SIGHUP signal to the process identified by
what’s inside /var/run/varnishncsa.pid and forces varnishncsa to
release and reopen the log file.
But on production systems, a service manager like systemd will be
used to start varnishncsa for you and will have reload logic to handle
the SIGHUP. The systemctl reload varnishncsa.service command handles
this.
VSL is consumed by three programs. We already talked about
varnishlog and varnishncsa. We still need to cover varnishtop.
The input that varnis``h``top consumes is the same: it reads from the
VSL circular memory buffer. The output, on the other hand, is very
different. varnishtop does not output log lines like the other tools.
It presents a continuously updated list of the most commonly occurring
log entries.
The tags that appear the most across transactions are displayed first.
Here’s a raw output extract when running varnishtop:
list length 8517

 11125.37 VCL_return     deliver
  5562.96 Begin          sess 0 HTTP/1
  5562.78 RespStatus     200
  5562.78 RespReason     OK
  5562.78 VCL_call       HASH
  5562.78 RespProtocol   HTTP/1.1
  5562.78 VCL_call       DELIVER
  5562.78 VCL_return     lookup
  5562.78 RespHeader     Server: nginx/1.19.0
  5562.78 RespHeader     Connection: close
  5562.78 RespHeader     X-Powered-By: PHP/7.4.7
  5562.78 RespHeader     Accept-Ranges: bytes
  5562.78 ReqHeader      Accept-Encoding: gzip
  5562.78 RespHeader     Date: Wed, 02 Dec 2020 16:23:15 GMT
  5562.78 RespHeader     Via: 1.1 varnish (Varnish/6.0)
  5562.78 RespHeader     Cache-Control: public ,max-age=100
  5562.78 RespHeader     Content-Type: text/html; charset=UTF-8
  5562.73 ReqMethod      GET
  5562.73 VCL_call       RECV
  5562.73 VCL_return     hash
It comes as no surprise that the VCL_return deliver log line is the
most popular. Given the traffic patterns of this example, it occurs
about 11125.37 times per second.
We have to be honest here: this output is not very helpful without proper tag filtering and VSL queries.
Here’s a more sensible varnishtop command:
varnishtop -i requrl
This command will list the most popular URLs. This could be the output:
list length 3

	31.67 ReqURL         /contact
	24.33 ReqURL         /products
	 8.50 ReqURL         /
This output shows that the /contact page is the most popular one with
an average of 31.67 requests per second.
Other questions that may be answered with varnishtop are:
And these questions are answered by the following varnishtop commands:
varnishtop -i ReqUrl -q "VCL_call eq 'MISS'"
varnishtop -i ReqUrl -q "VCL_return eq 'pass'"
varnishtop -i BeReqUrl -q "TTL[6] eq 'uncacheable'"
varnishtop -i BeReqUrl -q "Timestamp:Beresp[3] > 2.0"
varnishtop -i RespProtocol
varnishtop -I Begin:sess
We won’t be showing the output for the commands where only the ReqUrl
or BeReqUrl are used because that output is very predictable.
However, we am going to show some output for the last three commands.
Here’s the output you get when you want to figure out what the most popular HTTP version is:
list length 2
   310.29 RespProtocol   HTTP/1.1
	19.56 RespProtocol   HTTP/2.0
As you can see, the test setup received a lot more HTTP/1.1 requests
than HTTP/2.0 requests.
As far as HTTP versus HTTPS is concerned, you have to interpret the following output the right way:
list length 2

   234.25 Begin          sess 0 HTTP/1
	49.89 Begin          sess 0 PROXY
The sess 0 HTTP/1 log line represents straightforward HTTP requests
that were received via a standard HTTP listener. Because HTTPS was
terminated via Hitch and sent over the PROXY protocol, the
sess 0 PROXY log line represents HTTPS traffic.
Not that straightforward, admittedly. An easier way is to inject custom logging information, as illustrated below:
vcl 4.1;

import proxy;
import std;


sub vcl_recv {
	if(proxy.is_ssl()) {
		std.log("scheme: HTTPS");
	} else {
		std.log("scheme: HTTP");
	}
}
We can log the URL scheme using std.log() and use the scheme prefix
for filtering.
This would result in the following varnishtop command:
varnishtop -I VCL_Log:scheme
And finally, we would get some sensible output:
list length 2

	16.49 VCL_Log        scheme: HTTPS
	11.36 VCL_Log        scheme: HTTP
On Varnish Enterprise such custom logging is even required because
native TLS doesn’t use the PROXY protocol. There is no way to easily
distinguish HTTP from HTTPS via Begin:sess.
We can take our vmod_proxy example and refactor it for native TLS
purposes:
vcl 4.1;

import tls;
import std;


sub vcl_recv {
	if(tls.is_tls()) {
		std.log("scheme: HTTPS");
	} else {
		std.log("scheme: HTTP");
	}
}
This would allow us to use the same varnishtop -I VCL_Log:scheme
command and get the same type of output.
If you install Varnish via packages, not only is there a systemd unit
file for varnishd, there’s also one for varnishncsa.
It’s located in /lib/systemd/system/varnishncsa.service and looks like
this:
[Unit]
Description=Varnish Cache HTTP accelerator NCSA logging daemon
After=varnish.service

[Service]
RuntimeDirectory=varnishncsa
Type=forking
User=varnishlog
Group=varnish

ExecStart=/usr/bin/varnishncsa -a -w /var/log/varnish/varnishncsa.log -D
ExecReload=/bin/kill -HUP $MAINPID

[Install]
WantedBy=multi-user.target
The following varnishncsa command runs:
The fact that the -D option is used, means varnishncsa is daemonized
to run in the background. You are basically running varnishncsa as a
service. The service is managed by systemd.
However, the service is not active by default. Run the following
commands to enable and start the varnishncsa service:
$ sudo systemctl enable varnishncsa
$ sudo systemctl start varnishncsa
You’ll find the logs in /var/log/varnish/varnishncsa.log. The
logrotate service will ensure that the logs are properly rotated,
based on the /etc/logrotate.d/varnish configuration.
When log rotation is due, the systemctl reload varnishncsa.service
will be called via logrotate. As you can see, the
varnishncsa.service file handles reloads using the following command:
/bin/kill -HUP $MAINPID
And this brings us back to the SIGHUP signal that varnishncsa uses
to release and reopen the log file.
Without further adjustments to the varnishncsa.service file, the
standard log format will be used.
Please beware of using custom formats in varnishncsa.service. Please
note that systemd also uses percent % expansion in unit files. If
you’re changing the format via the -F option, you need to double the
percent signs in your format string.
For example the default format would look like this:
-F '%%h %%l %%u %%t "%%r" %%s %%b "%%{Referer}i" "%%{User-agent}i"'
Alternatively you can read the format from a file using the -f option
in your varnishncsa command.
Editing the service to modify the format can be done using the following command:
$ sudo systemctl edit --full varnishncsa.service
After having added a -F or -f option, and after having modified the
output format, don’t forget to restart the service using the following
command:
$ sudo systemctl restart varnishncsa.service

> Editing the unit file via `systemctl edit` results in a *symlink* of
> the unit file being created in `/etc/systemd/system`. You can also
> edit that file directly or create the *symlink* directly instead of
> using `sudo systemctl edit --full varnishncsa.service`. However, don't
> forget to call `sudo systemctl daemon-reload` before restarting your
> service.
By copying the varnishncsa.service and giving it another name, you can
run other varnishncsa services that may include custom formatting and
VSL queries. However, don’t forget to update
/etc/logrotate.d/varnish with the location and log-rotation scenario
for those services, otherwise you might run out of disk space.
To us, varnishlog is an indispensable tool.
You can set up Varnish and properly configure it. You can make sure your origin application sends the right HTTP headers to control the behavior of Varnish. You can even tailor the behavior of Varnish to your exact needs by writing VCL.
But how do you know your content delivery strategy is performing well?
VSL, and more specifically, varnishlog can answer that question in
great detail. Let’s approach this using the built-in VCL and ask
ourselves a very common question:
Why wasn’t this page served from cache?
You could list all transactions that resulted in a pass. The following command will help you with that:
$ varnishlog -i ReqUrl -i ReqMethod -i ReqProtocol -I ReqHeader:Host \
	-I ReqHeader:Cookie -I ReqHeader:Authorization \
	-i VCL_call -i VCL_return \
	-q "VCL_call eq 'PASS'"
You could also be looking at a specific URL and ask yourself the same question:
$ varnishlog -i ReqUrl -i ReqMethod -i ReqProtocol -I ReqHeader:Host \
	-I ReqHeader:Cookie -I ReqHeader:Authorization \
	-i VCL_call -i VCL_return \
	-q "ReqUrl eq '/'"
Let’s cover the various built-in VCL scenarios, and show how the
varnishlog output answers our question.
Remember: these decisions are made within the
vcl_recvsubroutine.
Based on the following output, we can conclude that http://localhost/
wasn’t served from cache because it was a POST call:
*   << Request  >> 2
-   ReqMethod      POST
-   ReqURL         /
-   ReqProtocol    HTTP/1.1
-   ReqHeader      Host: localhost
-   VCL_call       RECV
-   VCL_return     pass
-   VCL_call       HASH
-   VCL_return     lookup
-   VCL_call       PASS
-   VCL_return     fetch
-   VCL_call       DELIVER
-   VCL_return     deliver
Remember, only GET and HEAD requests are cached in the built-in
VCL.
The following output shows that the page wasn’t served from cache because the request contained a cookie:
*   << Request  >> 3
-   ReqMethod      GET
-   ReqURL         /
-   ReqProtocol    HTTP/1.1
-   ReqHeader      Host: localhost
-   ReqHeader      Cookie: lang=en
-   VCL_call       RECV
-   VCL_return     pass
-   VCL_call       HASH
-   VCL_return     lookup
-   VCL_call       PASS
-   VCL_return     fetch
-   VCL_call       DELIVER
-   VCL_return     deliver
The built-in VCL performs a pass when cookies appear in the request.
In situations where regsub(), regsuball(), cookie.delete(),
cookie.filter(), cookie.keep(), cookieplus.delete(), or
cookieplus.keep() are used to remove or keep specific cookies, it is
possible that an unexpected cookie slipped through the cracks and caused
an unexpected pass. VSL helps you figure this out.
The built-in VCL also doesn’t cache when an Authorization header is
part of the request.
You can easily spot it in the output below:
*   << Request  >> 98327
-   ReqMethod      GET
-   ReqURL         /
-   ReqProtocol    HTTP/1.1
-   ReqHeader      Host: localhost
-   ReqHeader      Authorization: Basic dGVzdDp0ZXN0
-   VCL_call       RECV
-   VCL_return     pass
-   VCL_call       HASH
-   VCL_return     lookup
-   VCL_call       PASS
-   VCL_return     fetch
-   VCL_call       DELIVER
-   VCL_return     deliver
There is still another reason why an object wasn’t served from cache. This situation doesn’t result in a pass, but instead results in a pipe.
This occurs when an unrecognized request method is used. return(pipe);
is called from within the VCL, and what was supposed to be an HTTP
request is simply treated as a TCP byte stream.
To track these kinds of requests, we need to slightly modify our
varnishlog command:
$ varnishlog -c -i ReqUrl -i ReqMethod -i ReqProtocol -I ReqHeader:Host \
	-I ReqHeader:Cookie -I ReqHeader:Authorization \
	-i VCL_call -i VCL_return \
	-q "VCL_return eq 'pipe'"
As you can see VCL_return eq 'pipe' is our VSL query, and this is
the result:
*   << Request  >> 20
-   ReqMethod      FOO
-   ReqURL         /
-   ReqProtocol    HTTP/1.1
-   ReqHeader      Host: localhost
-   VCL_call       RECV
-   VCL_return     pipe
-   VCL_call       HASH
-   VCL_return     lookup
Because our request method was FOO, the built-in VCL didn’t
exactly know what to do with that and decided to pipe the request
directly to the backend.
Whereas serving objects from cache is a client-side responsibility,
storing objects in cache is a backend responsibility. varnishlog
also has the capabilities of explaining why certain pages weren’t stored
in cache.
We will again base ourselves on the criteria of the built-in VCL. If
you remember the flow correctly, you’ll know that these decisions are
made in the vcl_backend_response subroutine.
This is the command we will use to figure out what’s going on:
$ varnishlog -g request -b -i BeReqUrl -I BerespHeader:Cache-Control \
	-I BerespHeader:Expires -I BerespHeader:Vary -I BerespHeader:Set-Cookie \
	-I BerespHeader:Surrogate-Control -i TTL -q "TTL[6] eq 'uncacheable'"
It’s quite lengthy, but here’s a breakdown for you:
-g request).-b).-i BeReqUrl).Cache-Control header
(-I BerespHeader:Cache-Control).Expires header
(-I BerespHeader:Expires).Surrogate-Control header
(-I BerespHeader:Surrogate-Control).Vary header should also be displayed (-I BerespHeader:Vary).Set-Cookie header is also an important part of the output
(-I BerespHeader:Set-Cookie).TTL tag will help us understand what TTL is chosen (-i TTL).TTL tag is used in the VSL query to only selected
uncacheable responses (-q "TTL[6] eq 'uncacheable'").The first case we’re going to examine is a zero TTL. This means that
the origin returned a Cache-Control header, or an Expires header,
which set the TTL to zero.
These are the cases that could trigger this:
Cache-Control: max-age=0
Cache-Control: s-maxage=0
Expires: Thu, 1 Jan 1970 12:00:00 GMT
A zero TTL can also be set in VCL:
set beresp.ttl = 0s;
Let’s have a look at some VSL output that shows this in the logs:
**  << BeReq    >> 24
--  BereqURL       /
--  BerespHeader   Cache-Control: max-age=0
--  TTL            RFC 0 10 0 1607071591 1607071591 1607071590 0 0 cacheable
--  TTL            VCL 0 10 3600 1607071591 cacheable
--  TTL            VCL 120 10 3600 1607071591 cacheable
--  TTL            VCL 120 10 3600 1607071591 uncacheable
The Cache-Control header has a max-age that is zero. This is enough
to set beresp.ttl to zero seconds.
The first occurrence of the TTL tag shows this:
RFC value indicates the TTL was set via headers.0.max-age value, is
also 0.Although it is considered cacheable at first, the built-in VCL will
set it to uncacheable, which triggers hit-for-miss behavior. And as
you can see the TTL is set to 120.
When the s-maxage is set to zero, even though max-age equals 100,
the same thing happens:
**  << BeReq    >> 32783
--  BereqURL       /uncacheable
--  BerespHeader   Cache-Control: max-age=100 s-maxage=0
--  TTL            RFC 0 10 0 1607072077 1607072077 1607072077 0 0 cacheable
--  TTL            VCL 0 10 3600 1607072077 cacheable
--  TTL            VCL 120 10 3600 1607072077 cacheable
--  TTL            VCL 120 10 3600 1607072077 uncacheable
The same thing happens when the Expires header is set to the past, but
the Cache-Control header has cacheable max-age and s-maxage
values:
**  << BeReq    >> 32798
--  BereqURL       /
--  BerespHeader   Cache-Control: max-age=100 s-maxage=100
--  BerespHeader   Expires: Thu, 1 Jan 1970 12:00:00 GMT
--  TTL            RFC 0 10 0 1607072365 1607072365 1607072364 0 0 cacheable
--  TTL            VCL 0 10 3600 1607072365 cacheable
--  TTL            VCL 120 10 3600 1607072365 cacheable
--  TTL            VCL 120 10 3600 1607072365 uncacheable
And even if max-age is greater than zero, it is still possible that
Cache-Control semantics prevent the object from being cached.
Here’s an example where private results in the object becoming
uncacheable:
**  << BeReq    >> 44
--  BereqURL       /
--  BerespHeader   Cache-Control: private, max-age=3600
--  TTL            RFC 3600 10 0 1607072499 1607072499 1607072498 0 3600 cacheable
--  TTL            VCL 3600 10 3600 1607072499 cacheable
--  TTL            VCL 120 10 3600 1607072499 cacheable
--  TTL            VCL 120 10 3600 1607072499 uncacheable
You see in the first occurrence of the TTL tag that the second-to-last
field is set to 3600. This corresponds to the max-age value from the
Cache-Control header. But because of the private keyword, the object
is going in hit-for-miss mode for the next two minutes.
Either private, no-cache, or no-store will cause this to happen.
Here’s an example where all three are used:
**  << BeReq    >> 32801
--  BereqURL       /
--  BerespHeader   Cache-Control: private, no-cache, no-store
--  TTL            RFC 120 10 0 1607072684 1607072684 1607072683 0 0 cacheable
--  TTL            VCL 120 10 3600 1607072684 cacheable
--  TTL            VCL 120 10 3600 1607072684 cacheable
--  TTL            VCL 120 10 3600 1607072684 uncacheable
The Surrogate-Control header is also an important one. When it
contains no-store, it takes precedence over any valid Cache-Control
header in the built-in VCL.
You can see for yourself in the following VSL output:
**  << BeReq    >> 32810
--  BereqURL       /
--  BerespHeader   Cache-Control: public ,max-age=100
--  BerespHeader   Surrogate-Control: no-store
--  TTL            RFC 100 10 0 1607073237 1607073237 1607073237 0 100 cacheable
--  TTL            VCL 100 10 3600 1607073237 cacheable
--  TTL            VCL 120 10 3600 1607073237 cacheable
--  TTL            VCL 120 10 3600 1607073237 uncacheable
Even though the
RFC 100 10 0 1607073237 1607073237 1607073237 0 100 cacheable line
indicates that the response is cacheable because of the Cache-Control
value, it eventually is deemed uncacheable because of the
Surrogate-Control: no-store header.
Setting a cookie implies a state change. The built-in VCL takes this into account and prevents such objects from being stored in cache.
As you can see in the following VSL output, despite the
Cache-Control header that resulted in a TTL of 100 seconds, the
object is still considered uncacheable. The Set-Cookie header is to
blame for that:
**  << BeReq    >> 59
--  BereqURL       /1
--  BerespHeader   Cache-Control: public ,max-age=100
--  BerespHeader   Set-Cookie: id=098f6bcd4621d373cade4e832627b4f6
--  TTL            RFC 100 10 0 1607073445 1607073445 1607073444 0 100 cacheable
--  TTL            VCL 100 10 3600 1607073445 cacheable
--  TTL            VCL 120 10 3600 1607073445 cacheable
--  TTL            VCL 120 10 3600 1607073445 uncacheable

#### Wildcard variations
There’s still one condition that would trigger hit-for-miss behavior that we need to cover: wildcard variations.
As you can see in the output below, the response contains a Vary: *
header:
**  << BeReq    >> 32813
--  BereqURL       /12
--  BerespHeader   Cache-Control: public ,max-age=100
--  BerespHeader   Vary: *
--  TTL            RFC 100 10 0 1607074172 1607074172 1607074172 0 100 cacheable
--  TTL            VCL 100 10 3600 1607074172 cacheable
--  TTL            VCL 120 10 3600 1607074172 cacheable
--  TTL            VCL 120 10 3600 1607074172 uncacheable
By setting a variation on every header, which is represented by the
asterisk, your hit rate is going to fall off a cliff. The built-in VCL
considers this to be an uncacheable case, which is reflected in the last
occurrence of the TTL tag.
We’ve reached the end of this section, and you must admit that it was quite in-depth. That is because VSL should be a crucial part of your debugging strategy.
Although monitoring counters via varnishstat can give you an
indication of what is going on, varnishlog, varnishncsa, and
varnishtop allow you to test some of these assumptions or conclusions.
Please also use VSL when setting up Varnish and when writing VCL. Sometimes your origin behaves differently than you would expect. The logs will help you figure out what’s going on and may result in VCL changes.
And finally, we would advise anyone to install Varnish and the VSL tools, even if you’re not planning to cache any HTTP responses. Just the fact of having such an in-depth tool with so many filtering capabilities is an asset on its own.