Uptime, throughput and performance are some of the key requirements of any service. Varnish happens to be really good at these things. But despite its capabilities, there is no guarantee that Varnish will perform great at all times.
Just like any program, process or service, monitoring tools are required to check the availability and efficiency of Varnish.
Tools like Nagios or Zabbix are very popular monitoring tools that check the availability of services and send alerts when warnings or critical errors occur.
For an HTTP service like Varnish, a typical HTTP check is often used to monitor the availability of Varnish.
There are also Varnish plugins for both Nagios and Zabbix, which dig a bit deeper. These plugins use Varnish’s built-in counters to monitor conditions that go way beyond general availability.
In these monitoring sections, we won’t be talking about Nagios or Zabbix. We’ll primarily focus on Varnish counters, and how you can retrieve and visualize them.
varnishstat is a program that can display the internal Varnish
counters. Here’s an extract of the output you may get when you run the
command:
Uptime mgt:      0+00:01:27                                                         Hitrate n:       10       14       14
Uptime child:    0+00:01:28                                                            avg(n):   0.1968   0.2143   0.2143

	NAME                                   CURRENT        CHANGE       AVERAGE        AVG_10       AVG_100      AVG_1000
MGT.uptime                              0+00:01:27
MAIN.uptime                             0+00:01:28
MAIN.sess_conn                               16395          0.00        186.31        219.27        231.37        231.37
MAIN.client_req                              16395          0.00        186.31        219.27        231.37        231.37
MAIN.cache_hit                               16291          0.00        185.12        219.27        231.37        231.37
MAIN.cache_miss                                104          0.00          1.18          0.00          0.00          0.00
MAIN.backend_conn                               47          0.00          0.53          0.00          0.00          0.00
MAIN.backend_reuse                              58          0.00          0.66          0.00          0.00          0.00
MAIN.backend_recycle                           105          0.00          1.19          0.00          0.00          0.00
MAIN.fetch_length                              105          0.00          1.19          0.00          0.00          0.00
MAIN.pools                                       2          0.00           .            2.00          2.00          2.00
MAIN.threads                                   127          0.00           .          127.00        127.00        127.00
MAIN.threads_created                           127          0.00          1.44          0.00          0.00          0.00
MAIN.busy_sleep                                 70          0.00          0.80          0.00          0.00          0.00
MAIN.busy_wakeup                                70          0.00          0.80          0.00          0.00          0.00
MAIN.sess_queued                                20          0.00          0.23          0.00          0.00          0.00
MAIN.n_object                                  105          0.00           .          105.00        105.00        105.00
MAIN.n_objectcore                              187          0.00           .          187.00        187.00        187.00
MAIN.n_objecthead                              187          0.00           .          187.00        187.00        187.00
MAIN.n_backend                                   2          0.00           .            2.00          2.00          2.00
MAIN.s_sess                                  16395          0.00        186.31        219.27        231.37        231.37
MAIN.s_fetch                                   104          0.00          1.18          0.00          0.00          0.00
You see the counters being listed with their absolute value, the change rate, and some averages.
varnishd process.varnishd process.The varnishstat program has a set of options that allow you to control
the output.
If you run varnistat without any options, you end up in curses mode,
which displays a continuously updated list of counters.
By adding -1, as illustrated below, the output is returned via
standard output:
$ varnishstat -1
The output is a lot more verbose and includes all counters, including the ones that have a zero value. Here’s a very small extract from a very long list:
MGT.uptime                 141         0.99 Management process uptime
MGT.child_start              1         0.01 Child process started
MGT.child_exit               0         0.00 Child process normal exit
MGT.child_stop               0         0.00 Child process unexpected exit
MGT.child_died               0         0.00 Child process died (signal)
MGT.child_dump               0         0.00 Child process core dumped
MGT.child_panic              0         0.00 Child process panic
MAIN.summs               73384       516.79 stat summ operations
MAIN.uptime                142         1.00 Child process uptime
MAIN.sess_conn           36469       256.82 Sessions accepted
MAIN.sess_drop               0         0.00 Sessions dropped
MAIN.sess_fail               0         0.00 Session accept failures
If you want to get the list of available counters with a description, but without the actual values, you can run the following command:
$ varnishstat -l
Because the output is so verbose, the -f option can be used to filter
the output based on a glob pattern.
Here’s an example where we only want to see the gauge values of the various shared memory allocation (SMA) stevedores:
$ varnishstat -f "SMA.*.g_*" -1
Here’s the output:
SMA.s0.g_alloc              40          .   Allocations outstanding
SMA.s0.g_bytes        41445760          .   Bytes outstanding
SMA.s0.g_space        63411840          .   Bytes available
SMA.Transient.g_alloc           23          .   Allocations outstanding
SMA.Transient.g_bytes         7176          .   Bytes outstanding
SMA.Transient.g_space            0          .   Bytes available
Because the storage wasn’t explicitly named in this case,
s0is the automatic name that is assigned to the storage. If multiple storage engines are configured, the number that is used increases.
What can we learn from these counters?
g_bytes + g_space) is 100 MB.SMA.s0.g_bytes indicates that 40 MB of storage is in use.SMA.s0.g_space says that about 60 MB is still available.SMA.Transient.g_space zero byte value.SMA.Transient.g_bytes counter.Here’s an example where we combine multiple filters:
$ varnishstat -1 -f "MAIN.cache_*" -f "MAIN.s_*" \
	-f "MAIN.n_object" -f "^*bytes" -f "^*pipe_*"
This command will print all the MAIN.cache_ counters, all the
MAIN.s_, and the MAIN.n_object counter. However, all counters that
end with bytes, or contain pipe_ will not be shown.
This results in the following output:
MAIN.cache_hit           26760        12.55 Cache hits
MAIN.cache_hit_grace            0         0.00 Cache grace hits
MAIN.cache_hitpass              0         0.00 Cache hits for pass
MAIN.cache_hitmiss           5112         2.40 Cache hits for miss
MAIN.cache_miss              5190         2.43 Cache misses
MAIN.n_object                2299          .   object structs made
MAIN.s_sess                 37263        17.48 Total sessions seen
MAIN.s_pipe                     0         0.00 Total pipe sessions seen
MAIN.s_pass                  5284         2.48 Total passed requests seen
MAIN.s_fetch                10474         4.91 Total backend fetches initiated
MAIN.s_synth                    0         0.00 Total synthetic responses made
And let’s break it down:
The output that varnishstat -1 returns uses new lines to delimit
counters and spaces to delimit columns for each counter. Pretty standard
stuff.
But you can also return the output as XML or JSON data by using the
-x or -j options.
The following command will return the hit and miss counters and return them in XML format:
$ varnishstat -f "MAIN.cache_hit" -f "MAIN.cache_miss" -x
This is the corresponding XML output:
<?xml version="1.0"?>
<varnishstat timestamp="2020-12-10T13:55:34">
	<stat>
		<name>MAIN.cache_hit</name>
		<value>45718</value>
		<flag>c</flag>
		<format>i</format>
		<description>Cache hits</description>
	</stat>
	<stat>
		<name>MAIN.cache_miss</name>
		<value>8949</value>
		<flag>c</flag>
		<format>i</format>
		<description>Cache misses</description>
	</stat>
</varnishstat>
The output adds a bit more context about the counters that are returned.
The <flag> and <format> tags are especially helpful.
In this case both counters have a <flag>c</flag> tag, which implies
that the counter is a regular counter, not a gauge. Its value can only
increase, not decrease.
Both counters also have a <format>i</format> tag, which implies that
the value is an integer.
But if we run varnishstat -f "SMA.s0.g_bytes" -x to get the current
size of the shared memory allocation stevedore, this is the XML
output you’d get:
<?xml version="1.0"?>
<varnishstat timestamp="2020-12-10T14:02:28">
	<stat>
		<name>SMA.s0.g_bytes</name>
		<value>18876</value>
		<flag>g</flag>
		<format>B</format>
		<description>Bytes outstanding</description>
	</stat>
</varnishstat>
The <flag>g</flag> specifies that this value is a gauge: it can
increase and decrease. The format of this output returns a byte value,
hence the <format>B</format> tag.
Let’s run the same commands again, and use the -j option to return
JSON output:
$ varnishstat -f "MAIN.cache_hit" -f "MAIN.cache_miss" -j
This is the corresponding JSON output:
{
  "timestamp": "2020-12-10T13:55:34",
  "MAIN.cache_hit": {
	"description": "Cache hits",
	"flag": "c",
	"format": "i",
	"value": 45718
  },
  "MAIN.cache_miss": {
	"description": "Cache misses",
	"flag": "c",
	"format": "i",
	"value": 8949
  }
}
Again, you see the flag and format fields, and if we run
varnishstat -f "SMA.s0.g_bytes" -j, we’ll see gauges and byte
counts:
{
  "timestamp": "2020-12-10T14:02:28",
  "SMA.s0.g_bytes": {
	"description": "Bytes outstanding",
	"flag": "g",
	"format": "B",
	"value": 18876
  }
}

#### Curses mode
Curses mode is actually the standard mode when you run varnishstat.
Only when you use the -1, -x, or -j mode, you’ll end up not using
curses.
The very first varnishstat example we showed you was in curses mode.
The output can be quite verbose, but just like in the other output
modes, you can use glob filters to reduce the noise.
Let’s run the following command in curses mode:
$ varnishstat -f "VBE.*"
This one will list some stats for every registered backend. The more backends you defined, the more output you’ll get.
Here’s some output while using a single backend:
Uptime mgt:      0+00:05:24                          Hitrate n:       10       51       51
Uptime child:    0+00:05:25                             avg(n):   0.7171   0.5066   0.5066

	NAME                      CURRENT        CHANGE       AVERAGE        AVG_10
MGT.uptime                 0+00:05:24
MAIN.uptime                0+00:05:25
MAIN.cache_hit                 122288        107.80        376.27        516.95
MAIN.cache_miss                  6931          1.00         21.33         26.08
VBE.boot.default.bere...         3.28M         1.77K        10.32K        11.73K
VBE.boot.default.bere...        62.68K        53.90        197.50        211.65
VBE.boot.default.bere...         2.73M         1.33K         8.59K         9.86K
VBE.boot.default.bere...         9.34M         4.79K        29.42K        33.60K
VBE.boot.default.conn               3          2.99           .            1.27
VBE.boot.default.req            14108          9.98         43.41         49.79
We deliberately kept the window size quite small while grabbing this output. This results in the
AVG_100andAVG_1000columns being hidden.
While we only filtered for counters matching the VBE category, some
extra MGT and MAIN counters ended up in the output as well.
Curses mode has some key bindings that allow you to manipulate the view.
When you use the <UP> or <DOWN> keys, you can navigate through the
counter list. At the bottom of your windows, you’ll see some extra
information when a specific counter is highlighted. Here’s what you see
when the VBE.boot.default.bereq_hdrbytes counter is selected:
	VBE.boot.default.bereq_hdrbytes                                          INFO  1-10/10
Request header bytes:
		Total backend request header bytes sent
You can also use <PAGEUP> or <b>, and <PAGEDOWN> or <SPACE> to
skip through page by page. And as expected, the <HOME> and <END>
keys are there to take you to the top and bottom of the list.
When you press the <d> key, you can toggle between showing and hiding
counters with a zero value. As you can see, some extra counters appear
in the output:
	NAME                                CURRENT        CHANGE       AVERAGE        AVG_10       AVG_100      AVG_1000
MGT.uptime                           0+00:14:03
MAIN.uptime                          0+00:14:04
MAIN.cache_hit                           248289          0.00        294.18          0.00         53.83        258.67
MAIN.cache_miss                           12872          0.00         15.25          0.00          2.57         12.21
VBE.boot.default.happy               0000000000     ________________________
VBE.boot.default.bereq_hdrbytes            6.05M         0.00          7.35K         0.00          1.23K         5.84K
VBE.boot.default.bereq_bodybytes         115.40K         0.00        140.01          0.00         23.23        110.58
VBE.boot.default.beresp_hdrbytes           5.05M         0.00          6.12K         0.00          1.03K         4.87K
VBE.boot.default.beresp_bodybytes         17.27M         0.00         20.95K         0.00          3.51K        16.65K
VBE.boot.default.pipe_hdrbytes                0           .             .            0.00          0.00          0.00
VBE.boot.default.pipe_out                     0           .             .            0.00          0.00          0.00
VBE.boot.default.pipe_in                      0           .             .            0.00          0.00          0.00
VBE.boot.default.conn                         0          0.00           .            0.00          0.05          0.23
VBE.boot.default.req                      26086          0.00         30.91          0.00          5.18         24.57
VBE.boot.default.unhealthy                    0           .             .            0.00          0.00          0.00
VBE.boot.default.busy                         0           .             .            0.00          0.00          0.00
VBE.boot.default.fail                         0           .             .            0.00          0.00          0.00
VBE.boot.default.fail_eacces                  0           .             .            0.00          0.00          0.00
VBE.boot.default.fail_eaddrnota...            0           .             .            0.00          0.00          0.00
VBE.boot.default.fail_econnrefused            0           .             .            0.00          0.00          0.00
VBE.boot.default.fail_enetunreach             0           .             .            0.00          0.00          0.00
VBE.boot.default.fail_etimedout               0           .             .            0.00          0.00          0.00
VBE.boot.default.fail_other                   0           .             .            0.00          0.00          0.00
VBE.boot.default.helddown                     0           .             .            0.00          0.00          0.00
When you press the <e> key, you can toggle the scaling values between
the byte count and the standard value that includes a suffix.
This is the standard scaling of values:
VBE.boot.default.beresp_bodybytes 18.22M 0.00 18.17K
Megabytes and kilobytes are used as a unit of size. When you press
<e>, this is what you’ll see for this counter:
VBE.boot.default.beresp_bodybytes 19105054.72 0.00 18606.08
There are also some hidden counters that are only there for debug
purposes. By pressing the <v> key, you cycle through the verbosity
levels.
info is the standard verbosity level.diag is the next level, which also shows diagnostic counters.debug is the final level, which also shows debug counters.You can test this by running the following command:
$ varnishstat -f "MAIN.n_obj_purged" -f "MAIN.esi_warnings" -f "MAIN.hcb_nolock"
MAIN.n_obj_purged is an informational counter that will be visible
by default.<v>, you’ll end up in diagnostic mode and the
MAIN.esi_warnings counter will appear.<v> again, you’ll end up in debug mode and the
MAIN.hcb_nolock counter will also appear.Make sure you press
<d>as well for this example because some of these counters may have a zero value, and would otherwise remain hidden.
By pressing the <+> and <-> keys, you can increase and decrease the
refresh interval. The standard refresh interval is one second.
Increasing or decreasing the interval is done per 0.1 second.
And finally you can press <q> to exit varnishstat.
The Varnish source code has hundreds of counters that keep track of measurable events. Here’s some example code that increases the cache hit counter when a cached object is served:
wrk->stats->cache_hit++;
As mentioned earlier, varnishstat is used to visualize these counters.
We already showed you a number of counters, but in this section we’ll highlight the most important counters, grouped per category.
There are about 130 main counters. They are prefixed with MAIN. and
give you a basic understanding of what is happening.
Here’s a first group of counters:
MAIN.uptime                    Child process uptime
MAIN.sess_conn                 Sessions accepted
MAIN.client_req                Good client requests received
MAIN.cache_hit                 Cache hits
MAIN.cache_hit_grace           Cache grace hits
MAIN.cache_hitpass             Cache hits for pass
MAIN.cache_hitmiss             Cache hits for miss
MAIN.cache_miss                Cache misses
MAIN.s_pipe                    Total pipe sessions seen
MAIN.s_pass                    Total passed requests seen
MAIN.s_fetch                   Total backend fetches initiated
MAIN.s_synth                   Total synthetic responses made
The fact that a description is part of the output doesn’t require much
elaboration. The MAIN.cache_* and MAIN.s_* counters give insight
into the finite state machine, and which paths are the most common.
You can have a pretty decent view of the offload using the counters. This means the number of requests that were offloaded from the origin. For the requests that weren’t offloaded, you can see why that was the case.
These are all basic counters, not gauges: they increase and cannot decrease. For analysis purposes the absolute values don’t always matter. It’s the change rate that matters.
There are also backend counters, session counters, threading counters, client counters, fetch counters, ban counters, workspace counters. A lot of counters, really.
Before we go to the next category, we just want to show you a set of
counters that start with MAIN.n_*. Here’s an extract of that list:
MAIN.n_object                  object structs made
MAIN.n_backend                 Number of backends
MAIN.n_expired                 Number of expired objects
MAIN.n_lru_nuked               Number of LRU nuked objects
MAIN.n_purges                  Number of purge operations executed
MAIN.n_obj_purged              Number of purged objects
The MAIN.n_object is a very common one to use. It indicates how many
objects are stored in cache. The other counters are also pretty
straightforward.
The counters of the management process are prefixed with MGT., and
only the MGT.uptime counter is displayed in the standard mode.
Here’s the complete list of management process counters:
MGT.uptime                     Management process uptime
MGT.child_start                Child process started
MGT.child_exit                 Child process normal exit
MGT.child_stop                 Child process unexpected exit
MGT.child_died                 Child process died (signal)
MGT.child_dump                 Child process core dumped
MGT.child_panic                Child process panic
When a counter like MGT.child_panic increases, you know something is
wrong.
When you run Varnish using the -s malloc runtime parameter, the
SMA counters will keep track of memory allocation and memory
consumption.
If you only use a single unnamed malloc stevedore, the standard name
will be s0. If you use two of them, both s0 and s1 counters will
exist.
However, if you use -s mem=malloc to name your stevedore that name
will be available on the counters instead of s0.
Here’s the list of SMA counters:
SMA.s0.c_req                   Allocator requests
SMA.s0.c_fail                  Allocator failures
SMA.s0.c_bytes                 Bytes allocated
SMA.s0.c_freed                 Bytes freed
SMA.s0.g_alloc                 Allocations outstanding
SMA.s0.g_bytes                 Bytes outstanding
SMA.s0.g_space                 Bytes available
SMA.Transient.c_req            Allocator requests
SMA.Transient.c_fail           Allocator failures
SMA.Transient.c_bytes          Bytes allocated
SMA.Transient.c_freed          Bytes freed
SMA.Transient.g_alloc          Allocations outstanding
SMA.Transient.g_bytes          Bytes outstanding
SMA.Transient.g_space          Bytes available
The counters that start with c_ are regular counters, and the ones
that start with g_ are gauges.
The most common ones you’ll use are SMA.s0.g_bytes and
SMA.s0.g_space to view memory usage and available space. These
counters are also available for the transient storage in the form of
SMA.Transient.g_bytes and SMA.Transient.g_space.
By default SMA.Transient.g_space will be zero because transient
storage is usually unbounded.
We’ve referred to the MAIN.backend_* counters earlier. These counters
paint a general picture of your backends. But there are also VBE
counters that focus on individual backends. The more backends you have,
the longer the output.
Here’s a collection of counters for backends defined in the standard
VCL configuration that was loaded at boot time. Hence the boot
prefix. As there is only one backend named default in that VCL
configuration, the VBE.boot.default.* prefix contains all the required
counters:
VBE.boot.default.happy         Happy health probes
VBE.boot.default.bereq_hdrbytes Request header bytes
VBE.boot.default.bereq_bodybytes Request body bytes
VBE.boot.default.beresp_hdrbytes Response header bytes
VBE.boot.default.beresp_bodybytes Response body bytes
VBE.boot.default.pipe_hdrbytes Pipe request header bytes
VBE.boot.default.pipe_out      Piped bytes to backend
VBE.boot.default.pipe_in       Piped bytes from backend
VBE.boot.default.conn          Concurrent connections to backend
VBE.boot.default.req           Backend requests sent
VBE.boot.default.unhealthy     Fetches not attempted due to backend being unhealthy
VBE.boot.default.busy          Fetches not attempted due to backend being busy
VBE.boot.default.fail          Connections failed
VBE.boot.default.fail_eacces   Connections failed with EACCES or EPERM
VBE.boot.default.fail_eaddrnotavail Connections failed with EADDRNOTAVAIL
VBE.boot.default.fail_econnrefused Connections failed with ECONNREFUSED
VBE.boot.default.fail_enetunreach Connections failed with ENETUNREACH
VBE.boot.default.fail_etimedout Connections failed ETIMEDOUT
VBE.boot.default.fail_other    Connections failed for other reason
VBE.boot.default.helddown      Connection opens not attempted
Some of these counters are byte counters; some of them regular ones.
The VBE.boot.default.happy is an odd one, though.
When we run varnishstat -x -f VBE.boot.default.happy to see the
details about this counter, this is the output we get:
<?xml version="1.0"?>
<varnishstat timestamp="2020-12-11T10:56:58">
	<stat>
		<name>VBE.boot.default.happy</name>
		<value>18446744073709551615</value>
		<flag>b</flag>
		<format>b</format>
		<description>Happy health probes</description>
	</stat>
</varnishstat>
This counter is not a regular one, nor is it a gauge. It’s a bitmap.
The 1 represents a successful health check. The 0 of the bitmap is a
failed health check.
The absolute integer value doesn’t really matter; the change rate does. When we see this counter in curses mode, it makes a lot more sense:
VBE.boot.default.happy ffffffffff VVVVVVVVVVVVVVVVVV______
We can conclude that the last five checks failed. This is visualized by
______.
The other counters can be used to get more information about the
offload of a specific backend. And if health checks start failing, the
VBE.boot.default.fail_* counters can tell you why.
Varnish Enterprise adds three extra categories of counters for MSE alone. When you run MSE using a single book and a single store, you already have more than 100 counters available. Most of which are diagnostic and debug counters.
Here’s some the output when running varnishstat -f MSE*:
	NAME                                    CURRENT        CHANGE       AVERAGE        AVG_10       AVG_100      AVG_1000
MGT.uptime                               0+00:09:24
MAIN.uptime                              0+00:09:25
MAIN.cache_hit                                13002         16.97         23.01         18.04          3.13          1.62
MAIN.cache_miss                                 655          1.00          1.16          1.46          0.33          0.17
MSE.mse.c_req                                     0           .             .            0.00          0.00          0.00
MSE.mse.c_fail                                    0           .             .            0.00          0.00          0.00
MSE.mse.c_bytes                               80.58M         1.05K       146.04K      1020.08K       353.78K       194.94K
MSE.mse.c_freed                               41.05M         1.05K        74.40K         2.22K       412.70        213.75
MSE.mse.g_alloc                                  41          0.00           .           38.82         38.53         38.53
MSE.mse.g_bytes                               39.53M        -1.00           .           37.43M        37.16M        37.16M
MSE.mse.g_space                              212.43M         0.00           .          221.63M       246.76M       249.25M
MSE.mse.n_lru_nuked                               0           .             .            0.00          0.00          0.00
MSE.mse.n_vary                                    0           .             .            0.00          0.00          0.00
MSE.mse.c_memcache_hit                         4.29G        33.54M         7.77M        36.68M         6.54M         3.39M
MSE.mse.c_memcache_miss                           0           .             .            0.00          0.00          0.00
MSE_BOOK.book.n_vary                              0           .             .            0.00          0.00          0.00
MSE_BOOK.book.g_bytes                         36.00K         0.00           .           33.53K        25.68K        24.87K
MSE_BOOK.book.g_space                         99.96M         0.00           .           99.97M        99.97M        99.98M
MSE_BOOK.book.g_banlist_bytes                     0           .             .            0.00          0.00          0.00
MSE_BOOK.book.g_banlist_space               1020.00K         0.00           .         1020.00K      1020.00K      1020.00K
MSE_BOOK.book.g_banlist_database                 16          0.00           .           16.00         16.00         16.00
MSE_STORE.store.g_aio_running                     0           .             .            0.00          0.00          0.00
MSE_STORE.store.g_aio_running_bytes               0           .             .            0.00          0.00          0.00
MSE_STORE.store.c_aio_finished                  101          0.00          0.18          1.03          0.35          0.19
MSE_STORE.store.c_aio_finished_bytes          79.14M         0.00        143.44K         1.02M       353.92K       194.44K
MSE_STORE.store.g_aio_queue                       0           .             .            0.00          0.00          0.00
MSE_STORE.store.c_aio_queue                       0           .             .            0.00          0.00          0.00
MSE_STORE.store.c_aio_write_queue_o...            0           .             .            0.00          0.00          0.00
MSE_STORE.store.g_objects                        20          0.00           .           18.94         18.80         18.80
MSE_STORE.store.g_alloc_extents                  20          0.00           .           18.94         18.80         18.80
MSE_STORE.store.g_alloc_bytes                 39.53M         0.00           .           37.43M        37.16M        37.16M
MSE_STORE.store.g_free_extents                    1          0.00           .            1.00          1.00          1.00
MSE_STORE.store.g_free_bytes                 984.46M         0.00           .          993.45M      1018.77M      1021.32M
There are three distinct counter categories related to MSE:
MSE: the memory caching counters of MSEMSE_BOOK: the persistence metadata counters per bookMSE_STORE: the persistence counters per storeThe MSE.mse.g_bytes and MSE.mse.g_space counters are very
straightforward: they let you know how much object storage memory is in
use, and how much is left for storing new objects.
The MSE.mse.n_lru_nuked lets us know how many objects were removed
from cache because of lack of space.
The MSE.mse.c_memcache_hit and MSE.mse.c_memcache_miss represent the
amount of hits and misses on the MSE memory cache.
Our test configuration only has one book named book, and one store
named store. Hence the MSE_BOOK.book.* and MSE_STORE.store.*
counters.
The MSE_BOOK.book.g_bytes and MSE_BOOK.book.g_space come as no
surprise, and require no additional information.
In terms of metadata, the MSE_BOOK.book.n_vary holds the number of
cache variations for that book. The MSE_BOOK.book.g_banlist_bytes
and MSE_BOOK.book.g_banlist_space refer to ban list journal usage,
whereas MSE_BOOK.book.g_banlist_database refers to persisted bans.
The MSE_STORE.store.g_objects counter counts the number of objects
stored in a store named store. That sounds quite poetic, doesn’t it?
And in the end, MSE_STORE.store.g_alloc_bytes counts the number of
bytes in allocated extents, and MSE_STORE.store.g_free_bytes counts
the number of free bytes in unallocated extents.
What you’ve seen so far are only the basic counters. If you increase the verbosity, there are more interesting counters available.
The waterlevel counters are particularly interesting, as they paint a picture of the continuous free space that is guaranteed by MSE:
MSE_BOOK.book.g_waterlevel_queue Number of threads queued waiting for database space
MSE_BOOK.book.c_waterlevel_queue Number of times a thread has been queued waiting for database space
MSE_BOOK.book.c_waterlevel_runs Number of times the waterlevel purge thread was activated
MSE_BOOK.book.c_waterlevel_purge Number of objects purged to achieve database waterlevel
MSE_STORE.store.g_waterlevel_queue Number of threads queued waiting for store space
MSE_STORE.store.c_waterlevel_queue Number of times a thread has been queued waiting for store space
MSE_STORE.store.c_waterlevel_purge Number of objects purged to achieve store waterlevel
And then there’s the anti-fragmentation counters. Here’s a small extract of these counters:
MSE_STORE.store.g_alloc_small_extents Number of allocation extents smaller than 16k
MSE_STORE.store.g_alloc_small_bytes Number of bytes in allocation extents smaller than 16k
MSE_STORE.store.g_alloc_16k_extents Number of allocation extents between 16k and 32k
MSE_STORE.store.g_alloc_16k_bytes Number of bytes in allocation extents between 16k and 32k
MSE_STORE.store.g_alloc_32k_extents Number of allocation extents between 32k and 64k
MSE_STORE.store.g_alloc_32k_bytes Number of bytes in allocation extents between 32k and 64k
MSE_STORE.store.g_free_small_extents Number of free extents smaller than 16k
MSE_STORE.store.g_free_small_bytes Number of bytes in free extents smaller than 16k
MSE_STORE.store.g_free_16k_extents Number of free extents between 16k and 32k
MSE_STORE.store.g_free_16k_bytes Number of bytes in free extents between 16k and 32k
MSE_STORE.store.g_free_32k_extents Number of free extents between 32k and 64k
MSE_STORE.store.g_free_32k_bytes Number of bytes in free extents between 32k and 64k
The full list goes way up and handles 11 different kinds of extents, each with their own counters. It’s impossible to cover them all, but at least you know what is out there.
When using vmod_kvstore, you can actually send custom counters to the
Varnish Shared Memory, which can be used by varnishstat.
Imagine the following VCL code:
vcl 4.1;

import kvstore;
import std;

sub vcl_init{
	new stats = kvstore.init();
}

sub vcl_recv {
	stats.counter("request_method_" + std.tolower(req.method), 1, varnishstat = true, "The number of HTTP " + req.method + " requests");
}
This code tracks the usage of the different request methods and stores
them with the request_method_ prefix. By setting the varnishstat
argument to true in the .counter() function, these counters can be
displayed via varnishstat.
If we were to run varnishstat -1 -f KVSTORE.*, we could end up seeing
the following output:
KVSTORE.stats.boot.__keys                 3   0.02 Number of keys
KVSTORE.stats.boot.request_method_get   816   4.23 The number of HTTP GET requests
KVSTORE.stats.boot.request_method_post   53   0.27 The number of HTTP POST requests
KVSTORE.stats.boot.request_method_head    7   0.04 The number of HTTP HEAD requests
Because we named our KVStore object stats, and our VCL
configuration is labeled as boot, the KVSTORE.stats.boot prefix is
going to appear in varnishstat.
Please note that
KVSTORE.*counters aren’t visible by default when running in curses mode. You either have to increase the verbosity or just use-1,-x, or-j.
Another interesting detail is the fact that there’s a comment argument where you can add more context and meaning to the counter you are returning.
varnishstat is a great tool. But if you have 50 Varnish servers to
monitor, you’re going to have a lot of work. One way or the other, all
these counters need to be centralized into a single database, and you’re
also going to want to visualize them using a dashboard.
There are many ways to do this, but we tend to prefer Prometheus for this.
Prometheus is an open-source monitoring and alerting tool that ingests timeseries data and has a built-in querying language called PromQL to retrieve metrics.
Data ingestion is based on an HTTP pull model. As long as the service you’re monitoring has an HTTP endpoint that exposes metrics in the right format, Prometheus can pull that data and store it in its database. We call these services exporters. Besides the standard node exporter to retrieve global server metrics, there are many custom exporters to expose custom metrics.
There are a lot of integrations with third-party tools for visualization and data retrieval. Grafana is one of those integrations. It allows you to create dashboards based on the PromQL syntax.
There’s only one piece of the puzzle that is missing: an exporter for Varnish.
There are a couple of Varnish exporters in the wild, and some of them are really good, such as https://github.com/jonnenauha/prometheus_varnish_exporter.
It is a project written in Go and is easy to build. It leverages the
varnishstat binary and exposes the output as Prometheus metrics.
Here are the options for the exporter:
$ prometheus_varnish_exporter --help

Usage of prometheus_varnish_exporter:
  -N string
		varnishstat -N value.
  -docker-container-name string
		Docker container name to exec varnishstat in.
  -exit-on-errors
		Exit process on scrape errors.
  -n string
		varnishstat -n value.
  -no-exit
		Deprecated: see -exit-on-errors
  -raw
		Raw stdout logging without timestamps.
  -test
		Test varnishstat availability, prints available metrics and exits.
  -varnishstat-path string
		Path to varnishstat. (default "varnishstat")
  -verbose
		Verbose logging.
  -version
		Print version and exit
  -web.health-path string
		Path under which to expose healthcheck. Disabled unless configured.
  -web.listen-address string
		Address on which to expose metrics and web interface. (default ":9131")
  -web.telemetry-path string
		Path under which to expose metrics. (default "/metrics")
  -with-go-metrics
		Export go runtime and http handler metrics
Debian and Ubuntu provide packages for
prometheus_varnish_exporter. It makes installation easier and comes out of the box with a Systemd service file.
Prometheus will call the exporter over HTTP via the
http://<hostname>:9131/metrics endpoint to retrieve the metrics.
If your Varnish server runs inside a Docker container and your
exporter doesn’t, you can even use the
prometheus_varnish_exporter -docker-container-name <name> command to
capture the varnishstat output from a container.
The output this Varnish exporter generates is extremely verbose, so here’s an extract of some of the metrics:
# HELP varnish_main_cache_hit Cache hits
# TYPE varnish_main_cache_hit counter
varnish_main_cache_hit 3055
# HELP varnish_main_cache_hit_grace Cache grace hits
# TYPE varnish_main_cache_hit_grace counter
varnish_main_cache_hit_grace 20
# HELP varnish_main_cache_hitmiss Cache hits for miss
# TYPE varnish_main_cache_hitmiss counter
varnish_main_cache_hitmiss 166
# HELP varnish_main_cache_hitpass Cache hits for pass
# TYPE varnish_main_cache_hitpass counter
varnish_main_cache_hitpass 0
# HELP varnish_main_cache_miss Cache misses
# TYPE varnish_main_cache_miss counter
varnish_main_cache_miss 187
# HELP varnish_sma_g_bytes Bytes outstanding
# TYPE varnish_sma_g_bytes gauge
varnish_sma_g_bytes{type="s0"} 4.144576e+07
varnish_sma_g_bytes{type="transient"} 2184
# HELP varnish_sma_g_space Bytes available
# TYPE varnish_sma_g_space gauge
varnish_sma_g_space{type="s0"} 6.341184e+07
varnish_sma_g_space{type="transient"} 0
Prometheus will call the Varnish Exporter endpoint, read the data, and store the 300+ metrics in its database.
Telegraf is an open-source server agent that collects metrics. It has
a wide range of input plugins and even has a native Varnish plugin.
It’s similar to prometheus_varnish_exporter but is more flexible.
Telegraf metrics aren’t restricted to Prometheus and can be used by various monitoring systems. However, it does make sense in our context to expose Telegraf metrics in a Prometheus format.
Here’s an example of a Telegraf configuration file:
[global_tags]
[agent]
  interval = "10s"
  round_interval = true
  metric_batch_size = 1000
  metric_buffer_limit = 10000
  collection_jitter = "0s"
  flush_interval = "10s"
  flush_jitter = "0s"
  precision = ""
  hostname = ""
  omit_hostname = false
 [[outputs.prometheus_client]]
  listen = ":9273"
  path = "/metrics"
 [[inputs.varnish]]
   binary = "/usr/bin/varnishstat"
   stats = ["MAIN.cache_hit", "MAIN.cache_miss", "MAIN.n_object"]
The [[outputs.prometheus_client]] directive will set the necessary
parameters for Prometheus to pull the metrics. The
[[inputs.varnish]] directive will set parameters for metrics retrieval
based on varnishstat.
A big difference in comparison to the Varnish Exporter is that you
have to define which metrics you want to retrieve. In this example,
we’re collecting MAIN.cache_hit, MAIN.cache_miss, and
MAIN.n_object. But it is also possible to specify a glob pattern to
retrieve multiple metrics at once.
Running Telegraf can be done via the
telegraf --config /path/to/telegraf.conf. But you might be better off
running this as a Systemd service. If you install Telegraf through
the packages provided by InfluxData, you’ll already have a Systemd
unit file.
These are the Varnish metrics coming out of Telegraf through
http://<hostname>:9273/metrics:
# HELP varnish_cache_hit Telegraf collected metric
# TYPE varnish_cache_hit untyped
varnish_cache_hit{host="varnish",section="MAIN"} 0
# HELP varnish_cache_miss Telegraf collected metric
# TYPE varnish_cache_miss untyped
varnish_cache_miss{host="varnish",section="MAIN"} 0
# HELP varnish_n_object Telegraf collected metric
# TYPE varnish_n_object untyped
varnish_n_object{host="varnish",section="MAIN"} 0
But as mentioned, you can specify which metrics you want to collect in the Telegraf configuration file.
Now that we’ve figured out a way to export metrics from Varnish, we
need to pull them from Prometheus. This requires a Prometheus server
to be set up. Packages will do the job quite easily and come with a
collection of exporters. The /etc/prometheus/prometheus.yml
configuration file defines how metrics will be collected.
Here’s a simplified configuration file that registers a Varnish exporter:
global:
  scrape_interval:     15s
  evaluation_interval: 15s
scrape_configs:
  - job_name: 'varnish'
	static_configs:
	- targets: ['varnish.example.com:9273']
When you navigate to the homepage of your Prometheus server, you’ll get a dashboard where you can search for metrics and where you can plot those metrics on a variety of graphs:
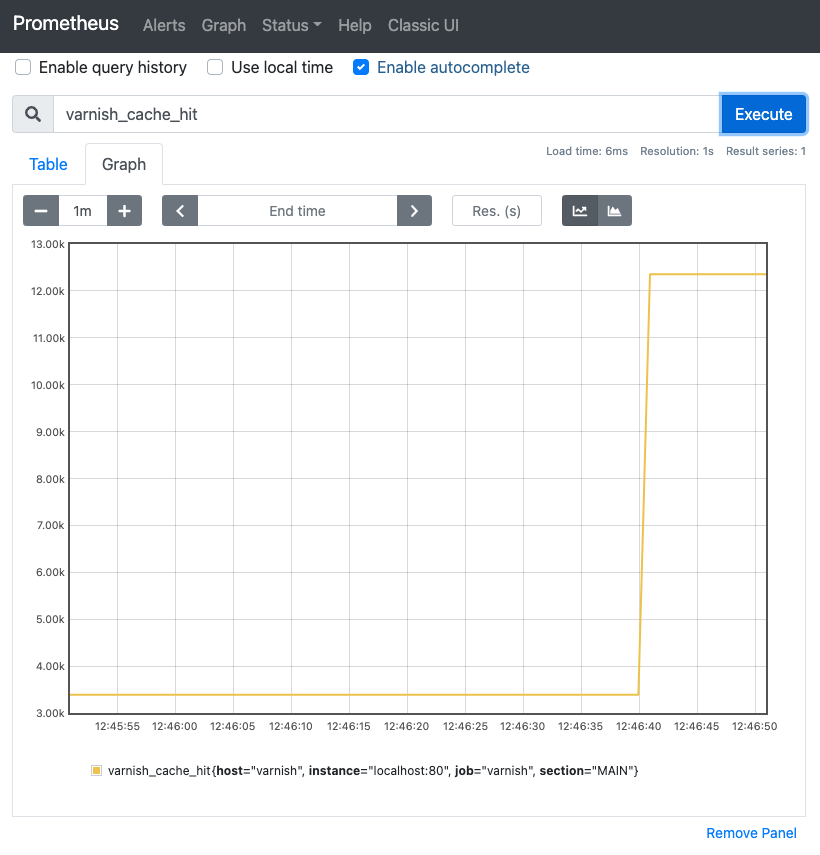
Although the Prometheus dashboard can do the job, it’s not a real dashboard service. There are better alternatives, and Grafana is one of them.
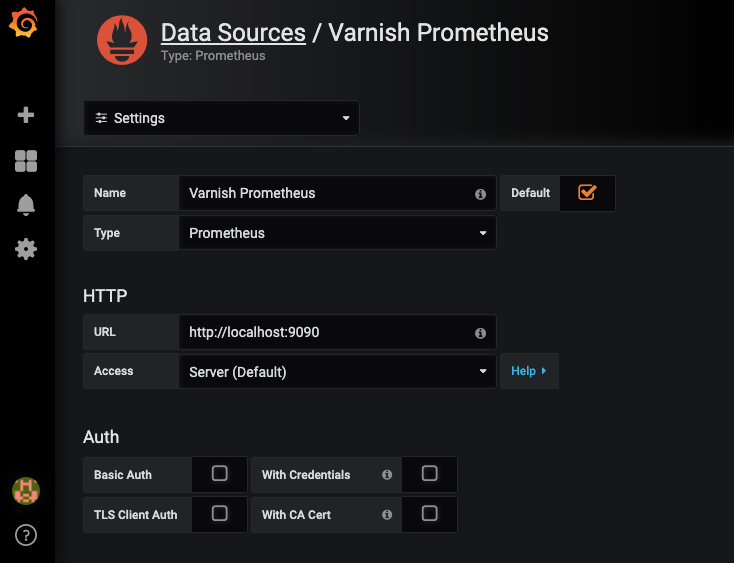
Grafana is a great way to visualize metrics and offers various different panels, dashboards, and plugins.
In our case, we want to make sure our Prometheus server is configured as a data source. This is very easy to configure in Grafana as you can see in the screenshot below:
Once Grafana is aware of the Prometheus metrics, we can create a dashboard. As you can see in the screenshot below, you can plot multiple Prometheus metrics on a graph:
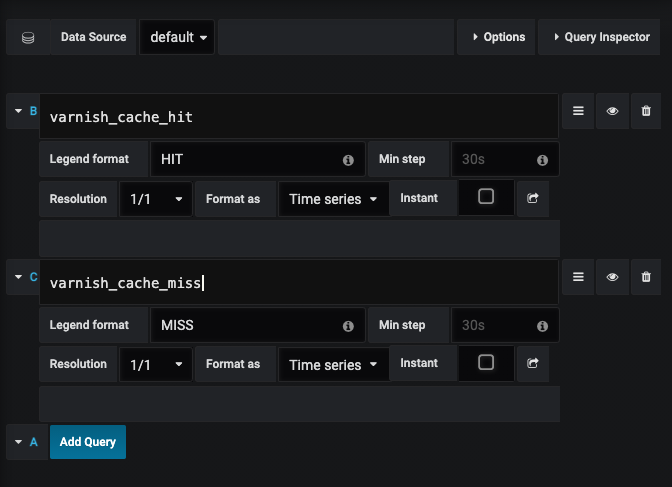
PromQL has various functions, expressions, and operators. You can filter metrics using various labels, and you can apply statistical functions. However, the details of this are beyond the scope of this book.
Here’s what the result looks like:
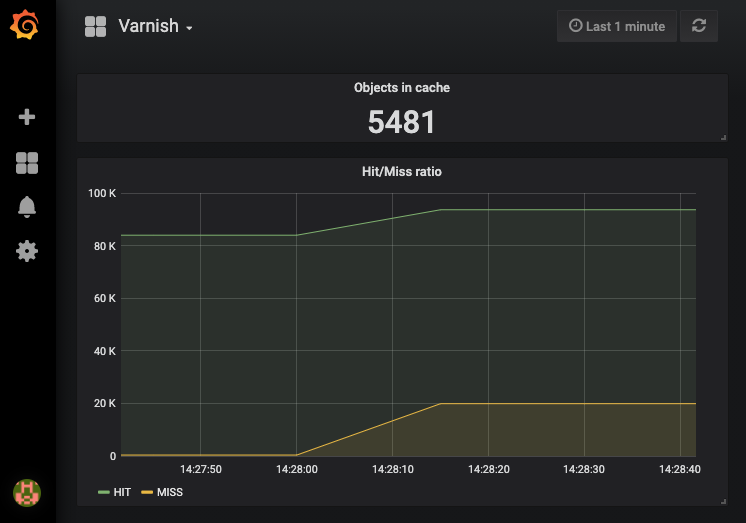
Besides the graph, we also defined a Singlestat that displays the current value of a metric. We use this to gauge the number of objects currently stored in cache.
We already know that KVStore counters can be used to display custom
varnishstat metrics. However, there’s also a Varnish Enterprise
product called Varnish Custom Statistics (VCS), which sends metrics
from a Varnish server via the VCS agent to a VCS server.
The difference with varnishstat is that VCS performs measurements
for a predefined set of metrics but grouped by keys that are defined
in VCL.
VCS metrics are stored in timeseries buckets. The length of a bucket defines the granularity of our measurements. The number of buckets we keep around will influence the total tracking time.
A bucket contains the following metrics:
| Field | Description |
|---|---|
timestamp |
This is the timestamp for the start of the bucket’s period |
n_req |
The number of requests |
n_req_uniq |
The number of unique requests, if configured through the vcs-unique-id key in VCL |
n_miss |
Number of cache misses |
avg_restarts |
The average number of VCL restarts triggered per request |
n_bodybytes |
The total number of bytes transferred for the response bodies |
ttfb_miss |
Average time to first byte for requests that resulted in a backend request |
ttfb_hit |
Average time to first byte for requests that were served directly from cache |
resp_1xx … resp_5xx |
Counters for response status codes |
reqbytes |
Number of bytes received from clients |
respbytes |
Number of bytes transmitted to clients |
berespbytes |
Number of bytes received from backends |
bereqbytes |
Number of bytes transmitted to backends |
pipe_bytes_in |
Number of bytes received from clients in pipe operations |
pipe_bytes_out |
Number of bytes transmitted to clients in pipe operations |
pipe_hdrbytes_req |
Number of bytes in headers received from clients where the request lead to a pipe operation |
pipe_hdrbytes_bereq |
Number of bytes in headers transmitted to backends where the request lead to a pipe operation |
Based on these metrics, other metrics can be calculated. For example: by subtracting
n_missfromn_req, we know the number of hits.
In your VCL file, you can define custom keys that will be collected by the VCS agent and aggregated in the VCS server.
Even if you don’t specify any custom keys, the VCS agent will create
three default keys if the -d option was passed to the vcs-agent:
ALLHOST/<host>URL/<url>The ALL key is a static key. It will be a constant value for all
requests to Varnish. The ALL key essentially provides an overview of
all incoming and outgoing requests.
The other two, HOST/<host> and URL/<url>, are dynamic keys. They
reflect individual requests to Varnish. Dynamic keys provide insight
into specific traffic patterns.
The VCL equivalent for these keys would be:
vcl 4.1;

import std;

sub vcl_deliver {
	std.log("vcs-key:ALL");
	std.log("vcs-key:HOST/" + req.http.Host);
	std.log("vcs-key:URL/" + req.http.Host + req.url);
}
For the http://example.com/welcome page, the keys would be as follows:
ALLHOST/example.comURL/example.com/welcomeFor each of these three keys the metrics can be retrieved via an HTTP API, TCP output, or the graphical user interface.
This is the HTTP API output of a single bucket for the ALL key:
{
	"timestamp": "2020-12-18T09:57:50+00",
	"n_req": 64,
	"n_req_uniq": 0,
	"n_miss": 11,
	"avg_restarts": 0.000000,
	"n_bodybytes": 72538778,
	"reqbytes": 12080,
	"respbytes": 72556553,
	"berespbytes": 9895,
	"bereqbytes": 2766,
	"pipe_bytes_in": 0,
	"pipe_bytes_out": 0,
	"pipe_hdrbytes_req": 0,
	"pipe_hdrbytes_bereq": 0,
	"ttfb_miss": 0.004838,
	"ttfb_hit": 0.000138,
	"resp_1xx": 0,
	"resp_2xx": 64,
	"resp_3xx": 0,
	"resp_4xx": 0,
	"resp_5xx": 0
}
Because our VCS server was configured with a bucket length of two
seconds, we can conclude that 64 requests were received in a
two-second time period. There were 11 misses. The logical conclusion
is that there were 53 hits. Every single request resulted in an
HTTP/2XX response status code.
If we wanted to investigate the 11 misses, we could request a top miss report from the VCS server:
{
	"ALL":11,
	"HOST/example.com":11,
	"URL/example.com/faq": 11
}
By default the top miss report will list up to ten keys that have the most misses in the latest bucket. We will talk more about top reports soon.
But what if you wanted more custom keys? As long as you log the right key, you can aggregate and query on any parameter that you want.
Let’s say you want to see the metrics per request method. You’d use the following VCL snippet to make this happen:
std.log("vcs-key:METHOD/" + req.method);
This would result in keys like:
METHOD/GETMETHOD/HEADMETHOD/POSTMETHOD/PUTMETHOD/DELETEMETHOD/OPTIONSHere’s another interesting use case: imagine we wanted to measure the
conversion from articles to a signup page. Basically, we’re tracking
conversions based on the referer request header.
Here’s the VCL to get it done:
vcl 4.1;

import std;

sub vcl_deliver {
	if (req.url == "/signup" && req.http.referer ~ "^https?://[^\/]+/article/([0-9]+)") {
		set req.http.articleid = regsub(req.http.referer,"^https?://[^\/]+/article/([0-9]+)","\1");
		std.log("vcs-key:CONVERSION/SIGNUP/" + req.http.articleid);
		unset req.http.articleid;
	}
}
If for example a person is reading https://example.com/article/1234
and clicks on a link that navigates to /signup, the resulting VCS
key would be:
vcs-key:CONVERSION/SIGNUP/1234
And eventually, the VCS server will allow you to visualize, report,
and query based on the custom CONVERSION/SIGNUP/<articleid> key.
The vcs-agent program reads the Varnish Shared Log and captures
vcs-key entries.
The agent then sends that data to the central vcs server program,
which is aggregated and persisted.
The VCS components, including the vcs-agent program, are part of
Varnish Enterprise. vcs-agent can be installed using the
varnish-custom-statistics-agent package on your Linux system.
The packages are proprietary and require a license key to be accessed.
If you’re on Debian or Ubuntu, you can run the following command:
$ sudo apt-get install varnish-custom-statics-agent
And on Red Hat or CentOS, it’s the following command:
$ sudo yum install varnish-custom-statistics-agent
The vcs-agent should be installed on every Varnish server you want
to monitor. Once the package is installed, you have to configure the
Systemd service file to make it work for you.
The following commands should be run to edit the configuration and restart the service with the new settings:
$ sudo systemctl edit --full vcs-agent
$ sudo systemctl restart vcs-agent
This is the standard vcs-agent.service file:
[Unit]
Description=Varnish Custom Statistics Agent
After=varnish.service

[Service]
Type=simple
# Give varnish a little startup pause
# Could be improved with notify functionality
ExecStartPre=/bin/sleep 2
ExecStart=/usr/sbin/vcs-agent -d localhost
Restart=on-failure

[Install]
WantedBy=multi-user.target
The -d parameter is what creates the default ALL, HOST, and URL
keys. The reference to localhost is the location of the VCS server.
You’ll most likely change that value and set it to the hostname of your
VCS server.
There are other vcs-agent command line options you can tune:
-g option will output debug information. This could be useful
when you’re troubleshooting.-k option allows you to customize the prefix that is used to
match VSL log entries. The default value is vcs-key.-m option sets the number of messages that should be queued when
the VCS server is not available. Setting it to zero will create an
unlimited queue.-p option sets the remote port the agent should use when
connecting to the server. The default value is 5558.-n option sets which Varnish instance the agent should read in
case multiple Varnish instances are hosted on the same machine.The VCS server collects, aggregates, and persists data from the VCS agents.
Installing the vcs can be done using packages.
The packages are also proprietary and require a license key to be accessed.
If you’re on Debian or Ubuntu, you can run the following command:
$ sudo apt-get install varnish-custom-statics
And on Red Hat or CentOS, you use the following command:
$ sudo yum install varnish-custom-statistics
There’s also a Systemd unit file. Here’s the content of vcs.service:
[Unit]
Description=Varnish Custom Statistics
After=syslog.target network.target

[Service]
Type=forking
PIDFile=/var/run/vcs.pid
ExecStart=/usr/sbin/vcs \
	-P /var/run/vcs.pid \
	-Z

[Install]
WantedBy=multi-user.target
The -P option will set the location of the PID file, and the -Z
option sets bucket timestamps to use the UTC time zone.
If you want to modify the runtime configuration, you can run the following commands:
$ sudo systemctl edit --full vcs
$ sudo systemctl restart vcs
You can change some of the vcs options prior to restarting the
service. Here are some of the options we haven’t yet discussed:
-b option sets the length of an individual bucket in seconds.
Defaults to 30. By setting -b 2, a bucket will aggregate two seconds
worth of data. This can be considered the level of granularity for
VCS.-m option sets the maximum number of buckets for a key.
Defaults to 15. If you multiply the number of buckets by the length of
a bucket, you get the total duration of the tracking period.-z option sets the listening port that a vcs-agent will
connect to. Defaults to port 5558.-a option sets the listening port for the HTTP interface.
Defaults to port 6555.-l option limits access to the HTTP interface using an ACL.
Setting it to -0.0.0.0/0,+192.168.0.0/16 will disable access for the
general public, and only allow access from the 192.168.0.0 IP range.-O option sets the hostname and port for TCP output. When
set, VCS will transmit finished buckets in JSON format using TCP.
This could be used for third-party processing or storage of the VCS
data.-u option sets the folder in which the UI files are stored.
Defaults to /usr/share/varnish-custom-statistics/html.-g option sets the debug level. This can be useful during
troubleshooting.-K option sets the credential file for basic HTTP
authentication to protect access to the HTTP endpoint.-d option sets the realm domain that is used with basic HTTP
authentication.Once you’re up and running, and the vcs-agent is sending data, you can
use the HTTP API to query VCS and to retrieve metrics in JSON
format.
The HTTP endpoint runs on port 6555 by default and provides both the
API and the GUI. There are various HTTP resources available at
that endpoint.
The homepage, the /#/live/keys resource, and the /#/live/realtime
resource display various elements of the graphical user interface,
which we’ll cover soon.
The /key/<key> resource, the /match/<regex> resource, the /all
resource, and the /status are API resources.
Let’s talk about /all first. This URL lists all available keys.
Here’s some example output for /all:
{
	"keys": [
	"URL/example.com/",
	"URL/example.com/welcome",
	"URL/example.com/contact",
	"URL/www.example.com/",
	"ALL",
	"HOST/example.com",
	"HOST/www.example.com",
	"METHOD/GET",
	"METHOD/POST",
	]

}
The output doesn’t require a lot more explanation and should make sense if you paid attention when reading the Defining keys subsection.
To see the bucket metrics for all keys, just enable verbose mode
/all?verbose=1:
{
	"keys": [
		"All": [
			{
			  ...
			}
		]
	]
}
The /match/<regex> resource matches keys based on a regular
expression. The regex should be URL encoded.
Here’s an example where we match all keys that start with
URL/example.com:
/match/URL%2Fexample.com%2F
This could be the output:
{
	"keys": [
	"URL/example.com/",
	"URL/example.com/welcome",
	"URL/example.com/contact"
	]
}
Another way of listing and sorting keys is with a top report.
A top report will examine all the keys in a request and return a sorted list of keys that is based on a specific metric.
The keys that will be examined by a top report is determined by either
the /all or the /match/<regex> API URL.
By appending one of the top reports to your key listing request, a sorted list of keys will be returned:
/top Sort based on number of n_req metric/top_ttfb Sort based on the ttfb_miss metric/top_size Sort based on the n_bodybytes metric/top_miss Sort based on the n_miss metric/top_respbytes Sort based on the respbytes metric/top_reqbytes Sort based on reqbytes metric/top_berespbytes Sort based on berespbytes metric/top_bereqbytes Sort based on bereqbytes metric/top_restarts Sort based on the avg_restarts metric/top_5xx, /top_4xx, /top_3xx, /top_2xx, /top_1xx Sort based
on number of resp_xxx metric/top_uniq Sort based on the n_req_uniq metricHere are a couple of top report examples:
/all/top
/all/top_4xx
/match/URL%2Fexample.com%2F/top_miss
/match/URL%2Fexample.com%2F/top_size
By default a top report will be ranked by a key’s latest bucket and will return a list of ten sorted keys.
It is possible to customize the top report by specifying the bucket
?b=<buckets> query parameter and/or the count /<count> parameter in
the API URL.
The count parameter determines the number of keys that will be returned.
Imagine if we wanted the top three keys that have the most cache misses. This would be the API URL:
/all/top_miss/3
If we wanted a similar report for all keys matching the example.com
URL, this would be the API URL:
/match/URL%2Fexample.com/top_miss/3
When processing a top report, the ranking will be based on a metric
value in one or more buckets. By default only the key’s latest bucket
will be used, but the bucket ?b=<buckets> query parameter can specify
the total number of buckets that should be summarized for a key.
Here’s an example where we want the top eight keys that have the most misses for the last five buckets:
/all/top_miss/8/?b=5
Once you’ve figured out what key you want to examine, based on the
various key filtering techniques, you can use the /key/<key> API URL
to retrieve all the key’s metrics.
Here’s the API URL we’re accessing when we want the metrics for the
URL/example.com/welcome key:
/key/URL%2Fexample.com%2Fwelcome
This could be the output:
{
	"URL/example.com/welcome": [
		{
			"timestamp": "2020-12-18T14:05:34+00",
			"n_req": 877,
			"n_req_uniq": 0,
			"n_miss": 0,
			"avg_restarts": 0.000000,
			"n_bodybytes": 546371,
			"reqbytes": 149967,
			"respbytes": 788865,
			"berespbytes": 0,
			"bereqbytes": 0,
			"pipe_bytes_in": 0,
			"pipe_bytes_out": 0,
			"pipe_hdrbytes_req": 0,
			"pipe_hdrbytes_bereq": 0,
			"ttfb_miss": 0,
			"ttfb_hit": 0.000129,
			"resp_1xx": 0,
			"resp_2xx": 877,
			"resp_3xx": 0,
			"resp_4xx": 0,
			"resp_5xx": 0
		},
		{
			"timestamp": "2020-12-18T14:05:32+00",
			"n_req": 249,
			"n_req_uniq": 0,
			"n_miss": 1,
			"avg_restarts": 0.000000,
			"n_bodybytes": 155127,
			"reqbytes": 42579,
			"respbytes": 223995,
			"berespbytes": 814,
			"bereqbytes": 193,
			"pipe_bytes_in": 0,
			"pipe_bytes_out": 0,
			"pipe_hdrbytes_req": 0,
			"pipe_hdrbytes_bereq": 0,
			"ttfb_miss": 0.006705,
			"ttfb_hit": 0.000286,
			"resp_1xx": 0,
			"resp_2xx": 249,
			"resp_3xx": 0,
			"resp_4xx": 0,
			"resp_5xx": 0
		}
	]
}
And finally, there’s the /status resource that displays some simple
counters which represent the state of the VCS server:
{
    "uptime": 93033,
    "n_keys": 24,
    "n_trans": 682026,
    "db_mem_usage": 1197760,
    "output_queue_len": 0
}
Let’s break down this output:
The HTTP API returns a lot of useful information. There is surely
enough flexibility to sort, group, and filter the metrics. However, the
output isn’t intuitive. That’s why the vcs HTTP endpoint can also
return a graphical user interface.
This GUI leverages the API and visualizes the metrics through graphs and counters. We’ll illustrate this fact using a set of screenshots.
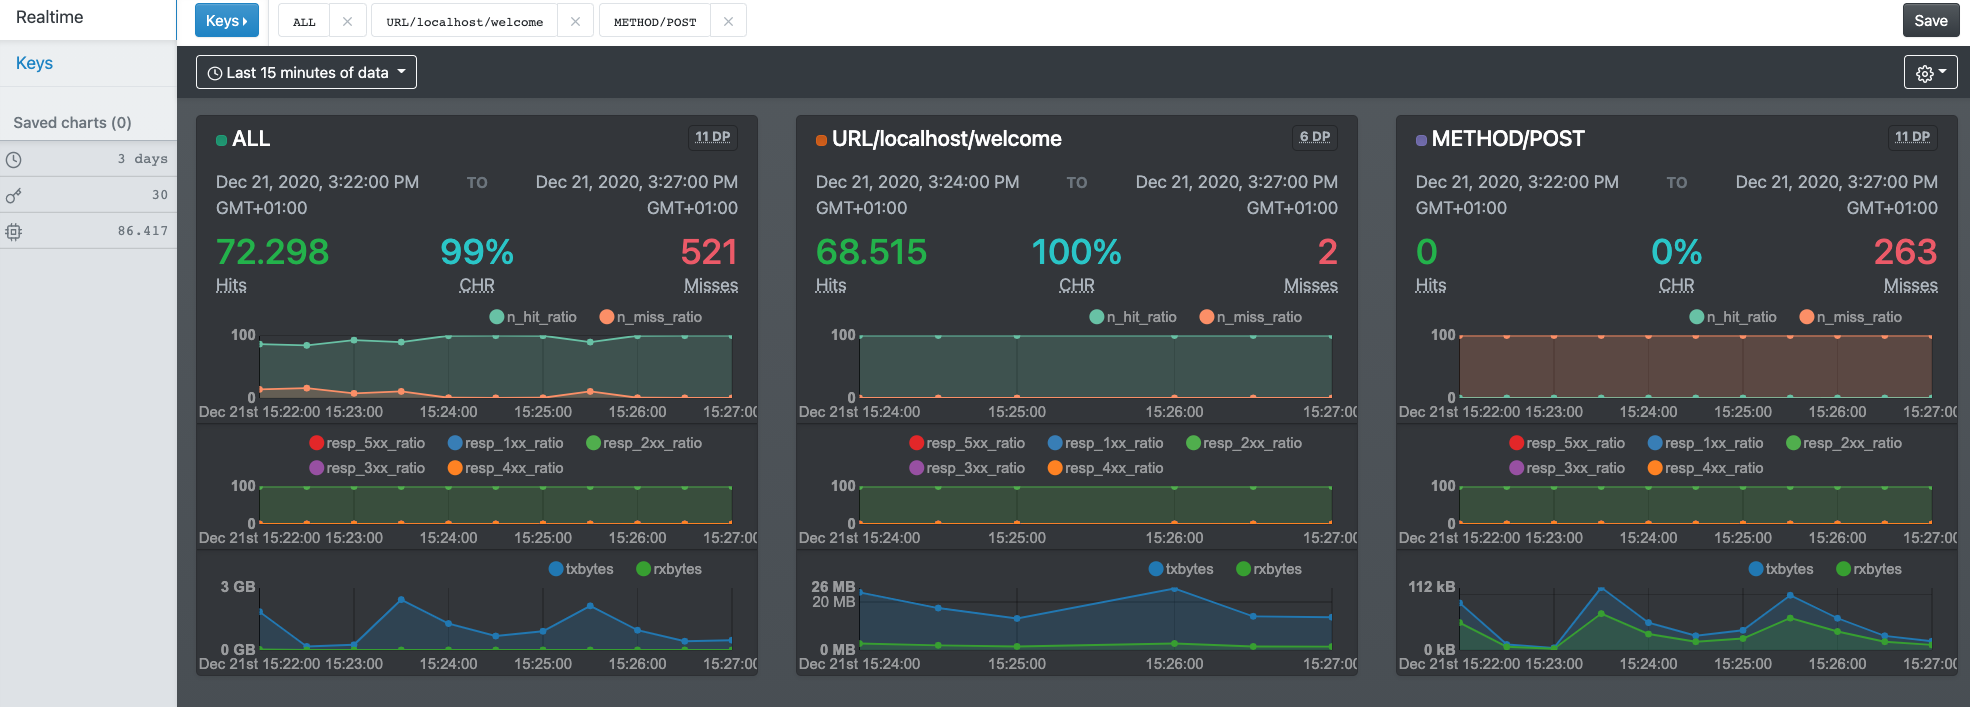
This first screenshot displays a set of metrics for three selected keys:
ALLURL/localhost/welcomeMETHOD/POSTThe metrics for the ALL key indicate that we have a cache hit ratio
(CHR) of 99%. All responses were in the 2XX range. When we look at
the results of the URL/localhost/welcome key, we notice a nearly 100%
hit rate. However, the METHOD/POST keys as a 0% hit rate, which makes
sense given built-in VCL behavior.
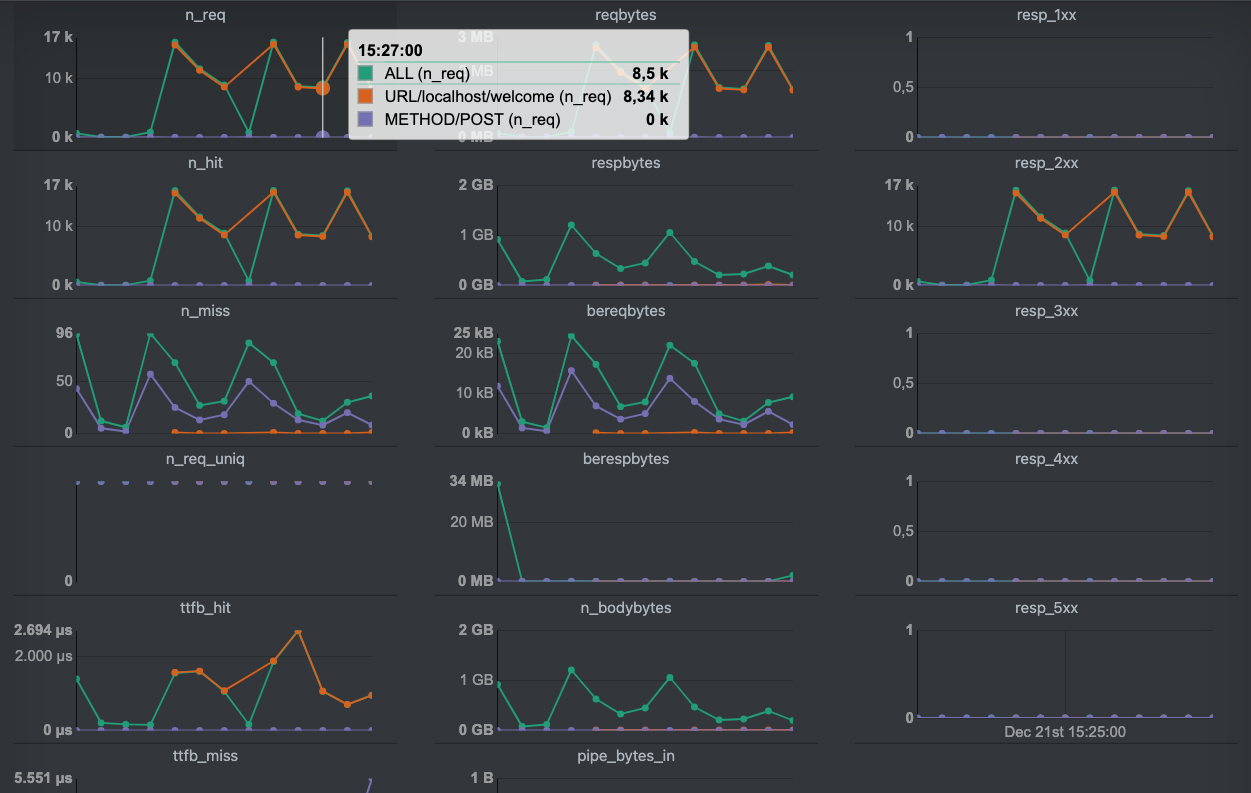
When we scroll down, we see the summarized metrics for all keys, which are shown in the second screenshot.
Each metric is displayed separately, and the results are plotted on the
graph per selected key. We highlighted a single measurement point on the
n_req graph, which visualizes the number of requests.
Our setup had a bucket length of 30 seconds, which means that in this
30-second interval, 8500 requests were processed, 8430 of which were
sent to http://localhost/welcome. The amount of HTTP POST requests
wasn’t high enough to be visible in this interval.
 be sorted on specific metrics, and the count and bucket parameters can
be specified.
be sorted on specific metrics, and the count and bucket parameters can
be specified.
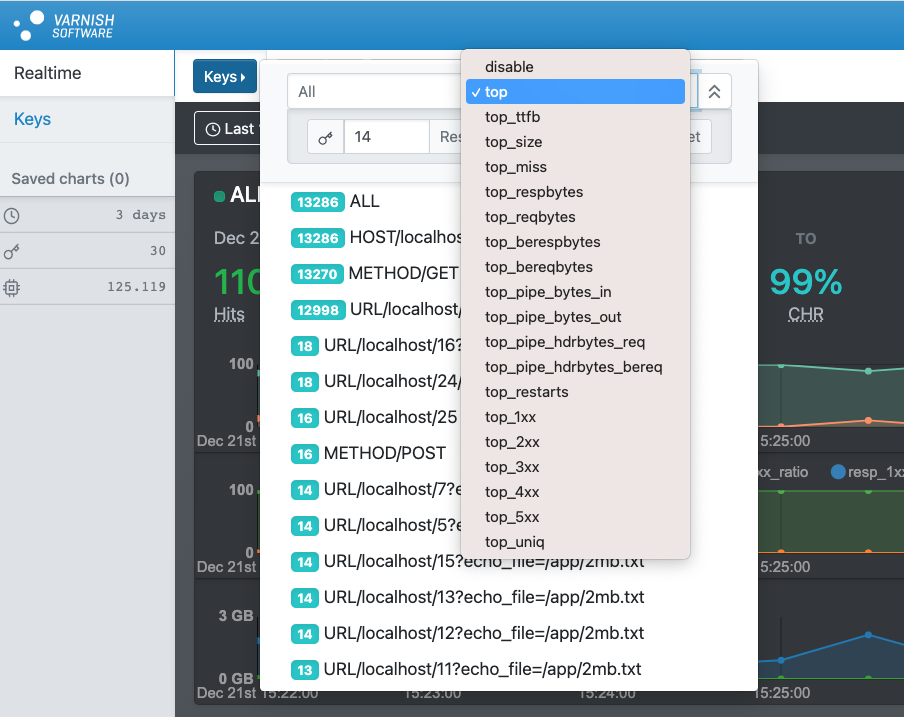
The list shows how metrics are available for the matching keys. By selecting a key, the corresponding metrics are added to the overview.
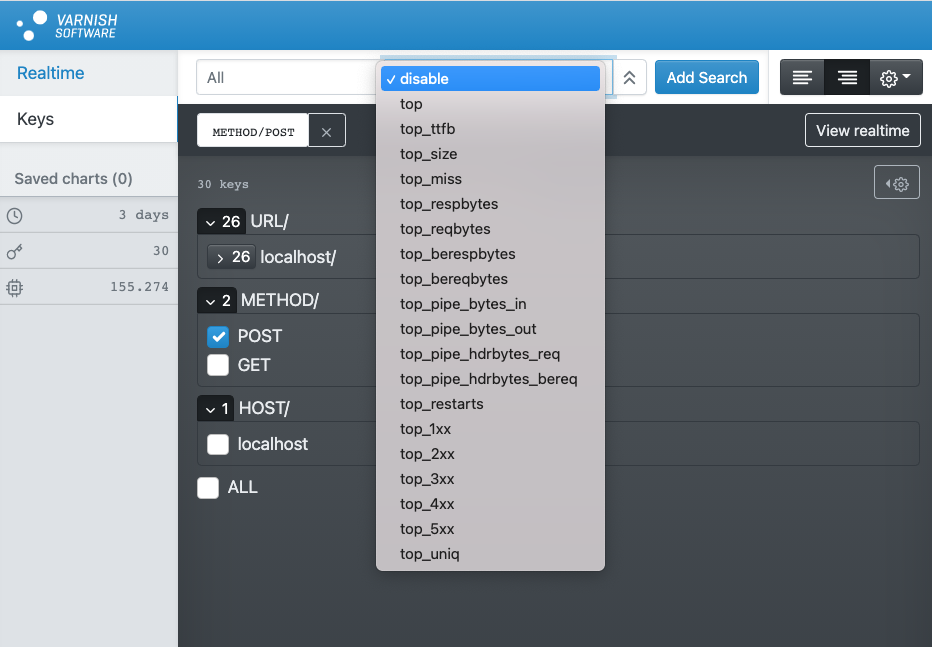
The final screenshot features a separate part of the VCS GUI that focuses on key selection. Key search and sorting is also supported. The selected keys can then be turned into a dashboard by pressing the View realtime button.
Metrics are interesting: graphs are fun and fancy, but they serve a purpose. The main purpose is understanding what’s going on under the hood. And when something goes wrong, the metrics and graphs should help you investigate why.
It’s not just about uptime and availability. Classic monitoring systems that perform an HTTP check can easily spot when Varnish is down. The problems that occur are often subtler and more related to performance and cacheability.
With the dozens of metrics that are available, it’s tough to see the forest for the trees. And a basic metric like the hit rate isn’t really a tell-tale sign.
The absolute values of the counters are often irrelevant: it’s the change rate that matters. However there are still some metrics you want to keep as low as possible.
The MGT.child_panic is one of the counters we want to see as low as
possible. A panic is always something that should be avoided. Panics can
be displayed by running varnishadm panic.show.
The MAIN.thread_queue_len metric should also be kept as low as
possible. Queued threads indicate a lack of available threads, which
means your varnishd process is either super busy, or your
thread_pool_max runtime parameter is set too low.
The MAIN.sess_fail metric should also be as low as possible. This
counter is the sum of all other MAIN.sess_fail_* counters. Here’s a
list of counters that track session failures:
MAIN.sess_fail_econnaborted: connection aborted by the client, which
is usually quite harmless.MAIN.sess_fail_eintr: the accept() system call was interrupted.MAIN.sess_fail_emfile: there are not file descriptors available.MAIN.sess_fail_ebadf: the listen socket file descriptor was invalid.MAIN.sess_fail_enomem: insufficient socket buffer memory.MAIN.sess_fail_other: some other reason, which will be clarified in
the debug log.It’s not just the session failures that indicate problematic behavior.
Sessions could also be queued while waiting for an available thread. The
MAIN.sess_queued counter exposes this kind of behavior. The
MAIN.sess_dropped counter will increase when there is a lack of worker
threads, and when the session queue is too long. The
thread_queue_limit runtime parameter controls the size of the thread
queue per thread pool.
Dropped sessions happen for HTTP/1.1 traffic. For HTTP/2 traffic,
the MAIN.req_dropped counter is used to count dropped streams.
The MAIN.n_lru_nuked counter indicates that the cache was full and
that the least recently used object was removed to free up space. When
this counter skyrockets, you should consider increasing the size of your
cache or re-evaluate the TTLs of your objects.
If you’re using MSE on Varnish Enterprise, you should have a look at
MSE.*.n_lru_nuked if you want to monitor object nuking.
Nuked objects aren’t great, but they are not catastrophic. But if the
MAIN.n_lru_limited counter increases, varnishd wasn’t able to nuke
enough space to fit the new object. The corresponding fetch will fail,
and the end user will either receive no response, or a partial response,
because of content streaming.
The nuke_limit runtime parameter indicates the number of nuking
attempts. The standard value is 50, and after 50 nuking attempts,
Varnish will give up, and the MAIN.n_lru_limited counter will
increase.
The failure to create enough free space is often a race condition between the thread that clears the space and another thread that tries to insert a new object. As mentioned before, MSE has a level of isolation to avoid these issues.
There are many other reasons why things go wrong, and many counters to visualize these issues. However, the counters tell you what’s going on, but not why these issues are occurring.
We have to revert to Varnish Shared Memory Logging to get more
information, and the Debug tag can help us with that. We can either
include the Debug tag in your regular VSL output, but we can also
filter out debugging information using the following command:
$ varnishlog -g raw -I Debug
The raw transaction grouping will ensure debug information is not restricted to sessions and requests. But as mentioned before, without VSL queries or rate limiting, the output will become overwhelming on a busy production server.
By default Varnish will not keep track of debugging information, but
the debug runtime parameter can enable and disable specific debugging
features.
There is an extensive list of debugging features, some of which are only used for testing. Here’s an example that includes some useful debugging symbols, which will be exposed in VSL:
$ varnishd -p debug=+req_state,+workspace,+waiter,+waitinglist,+lurker,+processors,+protocol
But as mentioned, enabling them all will result in a lot of noise. Be selective, consider using VSL queries, and also consider using rate limiting.
In chapter 1, we talked about the Varnish threading model as part of the Under the hood section.
It was made clear that both the manager and the child process use threads to perform various tasks.
varnishstat allows us to monitor various metrics, some of which relate
to Varnish’s threads. varnishlog provides information about
individual actions that leverage threads behind the scenes.
By running varnishscoreboard you can actually monitor the state of the
currently active threads on your Varnish server. This utility is part
of Varnish Enterprise and was redesigned for Varnish Enterprise
6.0.7r1.
Here’s some example output:
$ varnishscoreboard
Age      Type     State         Transaction Parent      Address             Description
   1.64s probe    waiting                 0           0 -                   boot.default
   2.11m acceptor accept                  0           0 :6443               a1
   2.11m acceptor accept                  0           0 :6443               a1
   2.11m acceptor accept                  0           0 :80                 a0
   0.03s acceptor accept                  0           0 :80                 a0
   0.01s backend  startfetch         360910      360909 -                   POST example.com /login
   0.01s client   fetch              360909      360908 172.19.0.1:63610    POST example.com /login
   2.11m acceptor accept                  0           0 :6443               a1
   2.11m acceptor accept                  0           0 :6443               a1
   2.11m acceptor accept                  0           0 :80                 a0
   0.01s acceptor accept                  0           0 :80                 a0
Threads running/in pool: 10/90
This output indicates that we have 100 worker threads available. Ten are running, and 90 are waiting in the thread pool. As we learned in the Under the hood section, there are a fixed number of threads for various tasks, but the worker threads are dynamic and are kept in thread pools.
The thread number in this example reflects the dynamic threads. The static ones are not reflected.
We also learn that there is a health probe available, which monitors
boot.default. This refers to the default backend, which was defined
in the boot VCL configuration.
There are also some acceptor threads active, both on port 6643 for TLS and port 80 for plain HTTP. These threads are responsible for accepting new connections.
There is a client-side thread that is fetching content from the backend.
This is done for an HTTP POST request to http://example.com/login.
This is also reflected in a corresponding thread that performs a backend
fetch.
Here’s another example:
$ varnishscoreboard
Age      Type     State         Transaction Parent      Address             Description
   0.00s session  newreq           11436541           0 172.19.0.1:60542
   1.07s client   transmit          8356616     8356615 172.19.0.1:60384    GET localhost /download/video.mp4
   0.37s client   transmit         11370849     7078552 -                   GET localhost /download/audio.mp3
   0.00s acceptor accept                  0           0 :80                 a0
   3.22s probe    waiting                 0           0 -                   boot.default
  37.70m acceptor accept                  0           0 :6443               a1
  37.70m acceptor accept                  0           0 :6443               a1
  37.70m acceptor accept                  0           0 :80                 a0
   0.00s acceptor accept                  0           0 :80                 a0
  37.70m acceptor accept                  0           0 :6443               a1
  37.70m acceptor accept                  0           0 :6443               a1
  37.70m acceptor accept                  0           0 :80                 a0
Threads running/in pool: 11/89
In this example you can also see new requests being made in the form of session threads. And you can also witness client threads performing transmissions. For large files it is easier to spot transmissions, as they take more time.
By default the
varnishscoreboarddoesn’t output anything. By enabling thescoreboard_enableruntime parameter invarnishd, the scoreboard will emit the right data. Please note that as of Varnish Enterprise 6.0.7r1 thescoreboard_enableruntime parameter is a deprecated alias ofthread_pool_track.