This tutorial explains how to debug Varnish Controller using built in tools to identify issues and troubleshoot problems.
This guide expects a full Varnish Controller environment to be running
Varnish Controller have a few built in tools that can be used to debug the components in the system. These built in tools are using the REST API and can be reached either via the REST API directly or using the VCLI.
The vcli have support for a debug command that can be issued towards agents and routers.
From version 4.0.0 of the controller, the debug output contains last logged errors and warnings. These log entries are also logged to stdout (syslog/systemd etc), but only the last (configurable) log entries are saved in this debug output. These log entries can give a lot of information if something has gone wrong.
# Debug a specific agent by ID
vcli agent debug <agent_id>

# Debug one or more agents using filtering
# Wildcards might have to be escaped depending on shell (\*server\*)
vcli agent debug -f name='*server*'
The output of this command is a JSON structure containing a lot of information from the agent(s), such as:
The same ‘debug’ call exists for the routers as well.
# Debug a specific router by ID
vcli router debug <router_id>

# Debug one or more routers using filtering
# Wildcards might have to be escaped depending on shell (\*router\*)
vcli router debug -f name='*router*'
The output is a JSON structure containing information for the router such as:
System debug is a feature used by the controller to bundle debug information from all available components in the Varnish Controller system. The command always takes 5sec to complete. During this time brainz will broadcast messages to all components in the system and wait for responses. The answers will be collected and reported back. The response will contain all components including brainz, agents, routers and api-gw processes.
Since the system is fully scalable, brainz has no actual control of how many components are running. Hence, it will only gather information from the ones responding to the broadcast request. It could miss components that are currently not reachable via NATS.
# Print system debug JSON to stdout
vcli debug

# Save JSON output to file
vcli debug --file=/tmp/debug.json

# Upload the output to Varnish Software filebin for help in support cases.
vcli debug -u <ticket_id>
The system debug contains a lot more information than the individual agent/router debug outputs.
When debugging, interesting parts is especially the database information, API-GW timing information (if any API call takes long time).
Varnish Controller supports to execute arbitrary commands towards all varnish servers and return back the result. This can be useful to gather information from varnish itself from one, all or a set of servers.
For example fetching the last panic using vcli:
# Show panic for agent with ID 1
vcli command panic.show -f id=1

# Show panic for agents with name matching *server*
vcli command panic.show -f name='*server*'

# Show panic for all varnish servers
vcli command panic.show

# Example output:
$ vcli command panic.show -fname='*server*'
+---------+-------+--------+--------------------------------+
| AgentID | Error | Status |             Result             |
+---------+-------+--------+--------------------------------+
|       1 |       |    300 | Child has not panicked or      |
|         |       |        | panic has been cleared         |
|       2 |       |    300 | Child has not panicked or      |
|         |       |        | panic has been cleared         |
|       3 |       |    300 | Child has not panicked or      |
|         |       |        | panic has been cleared         |
+---------+-------+--------+--------------------------------+
The same vcli command can be used for any command that varnishadm supports (e.g. vcl.list to show VCLs loaded into varnish).
Note that making configuration changes of varnish parameters using the vcli command will not be persistant after a varnish restart.
Varnish controller saves its own logs to the database. These logs mostly contains errors/information originating from API requests. These logs can give some information on failed actions and API calls.
How long time log entries are saved can be configured with brainz (-keep-api-logs, VARNISH_CONTROLLER_KEEP_API_LOGS and takes a duration like 3h30m).
To view and filter on these logs, using the vcli:
# Show all log entries with severity = error
vcli apilogs ls -f severity=3

# Show all logs entries with msg containing 'denied'
vcli apilogs ls -f msg=*denied*

# Show all session entries with msg containing 'magnus' to view logins for a user.
apilogs ls -f key_type=session -f msg='*magnus*'
All components log to stdout which ends up in either syslog, container logs or systemd journal depending on how the processes are run.
All components (except NATS) have a set of log levels, info, warning, error and debug. For debugging a component, it’s
recommended to add -log debug (VARNISH_CONTROLLER_LOG=debug) to increase logging. The components will output a lot of debug
information, so make sure to disable this after debugging.
Some examples of viewing these logs on different systems, tailing the log in real-time:
# Systemd to view logs on the agent
journalctl -u varnish-controller-agent -f

# For a docker container
docker logs <container_id> -f

# Docker-compose
docker-compose logs -t --tail=100 <container_name> -f

# Syslog  (/var/log/messages in some distributions)
tail -f /var/log/syslog |grep -i "varnish-controller-"
From version 5.0 it is possible to retrieve debug information for a single agent or router from the UI.
Note: You will need to be logged in as a system administrator or own the resource via private tokens to retrieve the debug information
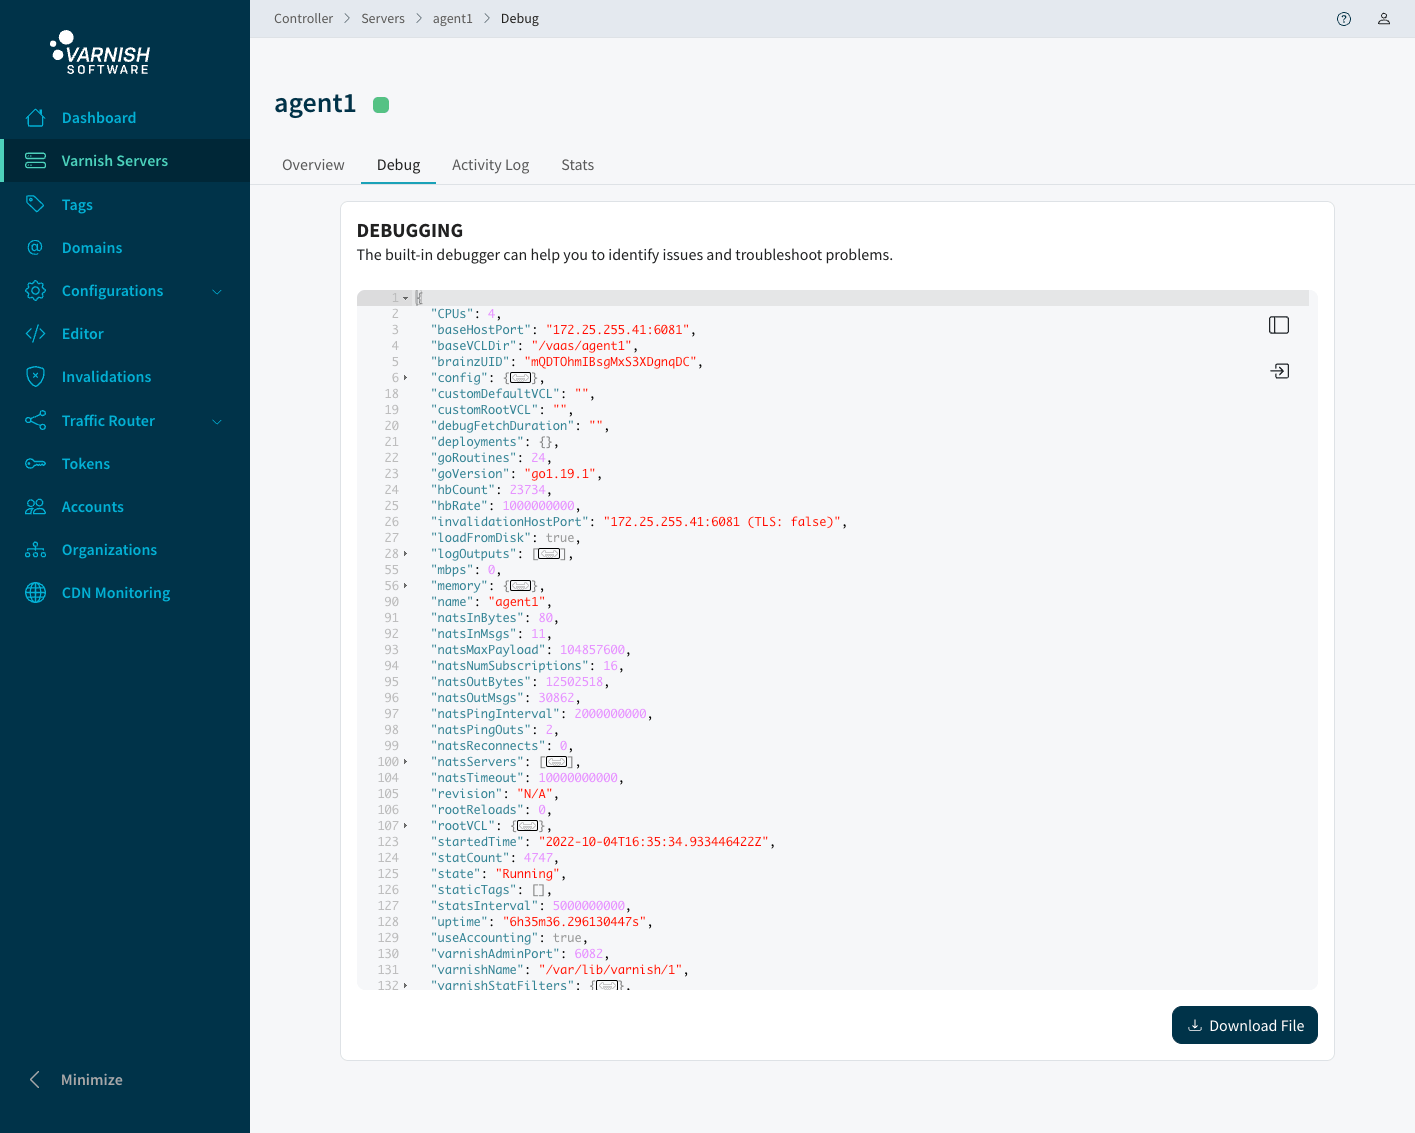
Navigate to an agent or router that you can access the debug view from, and click the debug tab.
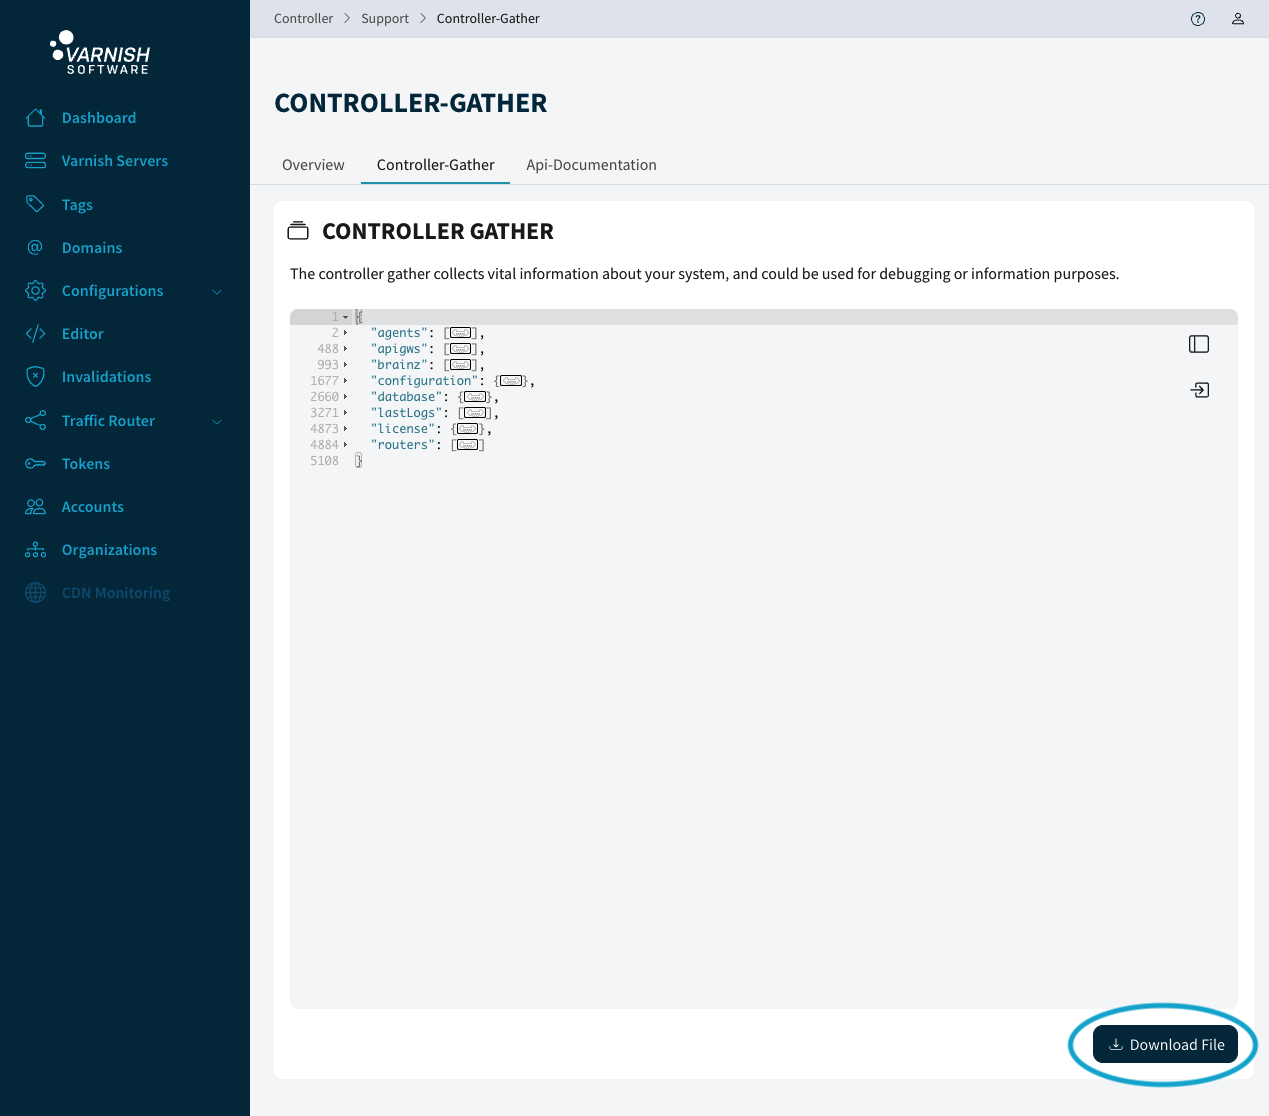
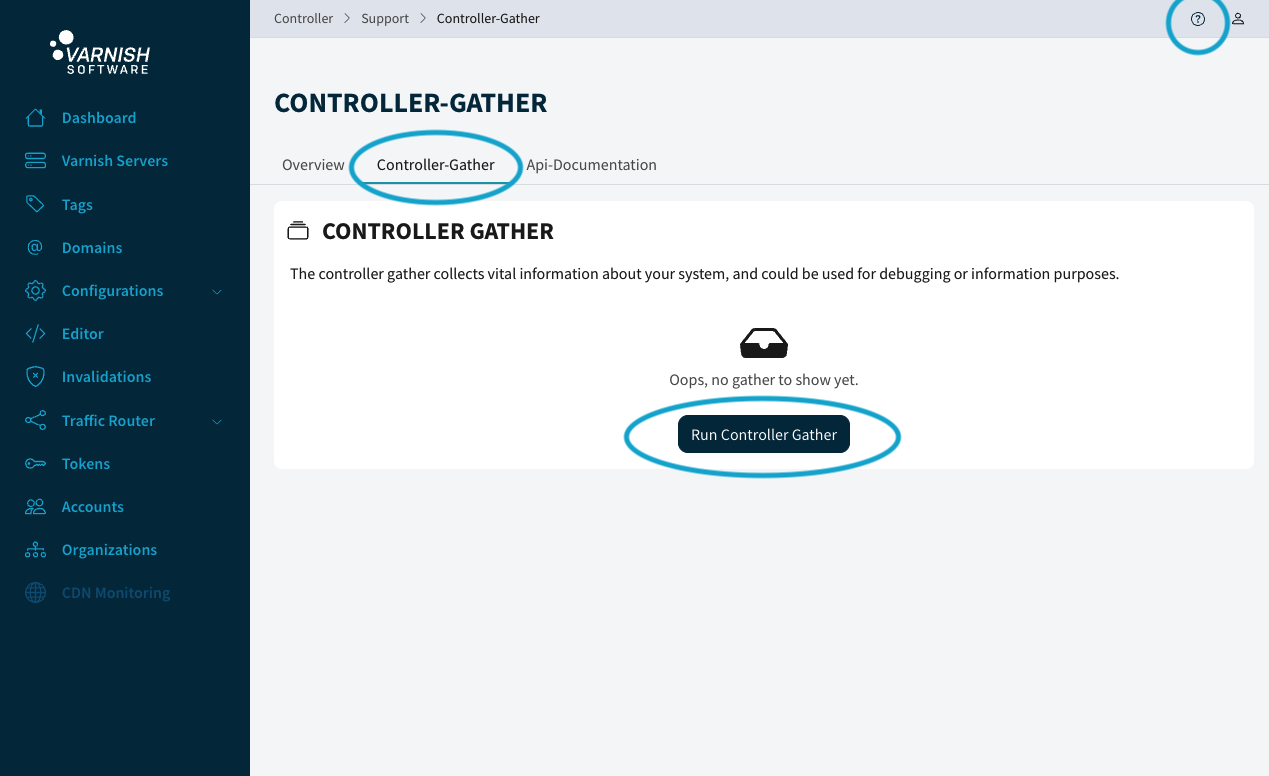
From version 4.1.0 it is possible to retrieve the Controller gather from the UI.
Note: You will need to be logged in as a system administrator to retrieve all the debug information
Go in the main menu at the left of the page to the bottom and click on Help And Support.
Click at the top of the page on Controller-gather, next click on the Run Controller Gather button.
When the data is retrieved it is displayed on the page. At the bottom of the data you see a button, click on the Download File button to download the Controller gather.